Why are human networks important? Part three
With this blog post, we conclude a three-part series by network analysis expert and (R)E-TIES researcher Valdis Krebs on human relationship networks. In this final installment, he turns to a new type of data: while the earlier posts focused on one-mode network data – relationships between nodes of the same type (e.g., people-to-people) – this entry explores two-mode data, which captures relationships between two different types of nodes (e.g., people and documents).
Uncovering social circles through town event attendance
The first network we will look at is from 1941. It started out as a normal one-mode network project. But researchers were having a hard time finding enough people to interview about their local social ties.
While discussing their data predicament, one of the researchers was flipping through the local town newspaper. He quickly saw a way out of their dearth of data dilemma. He showed his colleagues how the newspaper reported who went to which town event. Using the sociological concept of homophily1, event attendance might reveal the social circles in town.
Via several issues of the newspaper, from the local library, the researchers were able to assemble the social matrix shown in Figure 9a. The top row lists the social events and when they happened. The left column lists the names of the people who attended one event or more. An X is drawn in the box if a certain person attended a particular event.
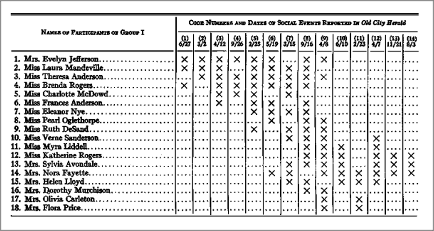
figure 9a.
The network drawn from the data in the social matrix is shown in Figure 9b. People are shown as blue circles, and the events are shown as green squares. An arrow is drawn from a circle to a square if that person attended that event. The matrix had data on 18 people and 14 events.
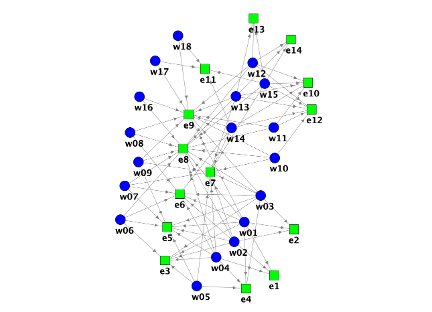
Figure 9b.
Figure 9b shows all the data gathered. Yet, it does not show the social structure of the town. To find the emergent social structure the researchers converted the two-mode social matrix to one-mode data (from “people to events”, to “people to people”). The more two people attended the same events the stronger their tie.
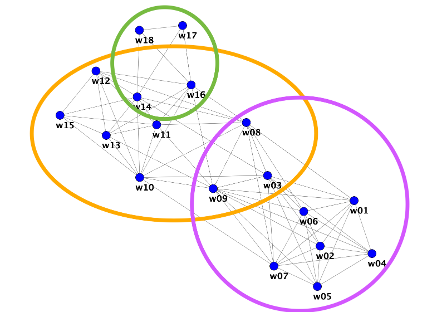
Figure 9c.
Figure 9c shows the social structure of this town. The colored circles show the emergent clusters in the social data. Network diagrams can show as Venn diagrams by looking at who mostly belongs to one cluster and who spans more than one cluster with their connections.
Two large emergent social circles (orange & purple) show up with a smaller circle (green) being a sub-group of the orange group.
Mapping research connections through publications
The next network diagram is a one-mode projection of two-mode data (publications and authors) from the popular PubMed database. Two authors are connected if they frequently co-authored the same publication.
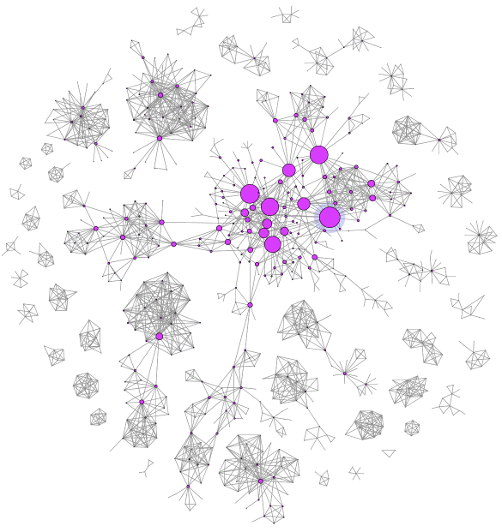
Figure 10.
Figure 10 shows us a giant connected component in the center of the diagram, with many smaller clusters of researchers along both sides. Node size shows quantity of connectivity of the authors.
Political alignment revealed through voting behavior
How do you judge a politician – by what they say or by what they do? We think that all members of a single political party all vote the same - they would do as their party leaders instructed. But this is not so.
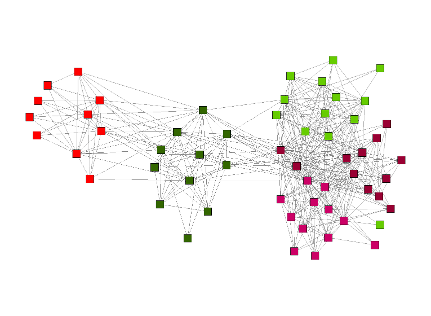
Figure 11.
Figure 11 shows the emergent network of voting patterns in the 11th Latvian Saeima. We see an interesting alignment of political parties based on the voting behavior of all legislators. Here the two-mode network is politicians and the legislation they vote on.
Each node represents a member of the Saeima. Their node color represents their party. Two nodes are linked if they frequently vote the same on a particular piece of legislation. The three Latvian national parties are on the right side of the network, clustered together, showing how they usually vote as a single block. On the left side of the network is the main party of the Russian-speaking population. They have no direct voting connections with the parties on the right side of the network. The party in the center of the network, Farmers & Greens, seem to be intermediaries - some of them vote with legislators on the right and the left sides of the network. You cannot judge a politician by the party they belong to. Their true stripes are revealed by their voting behaviour. Your choices reveal who you are, and who you are like.