Why are human networks important? Part two
With this blog post, we continue the three-part series by network analysis expert and (R)E-ties researcher Valdis Krebs on human relationship networks. In this installment, the researcher uses various data and visualisations to show how social network analysis can help us understand the structure of human relationship networks.
Board member networks in companies
Every company has a board of directors. The board members all interact with each other, so they show as fully connected networks.
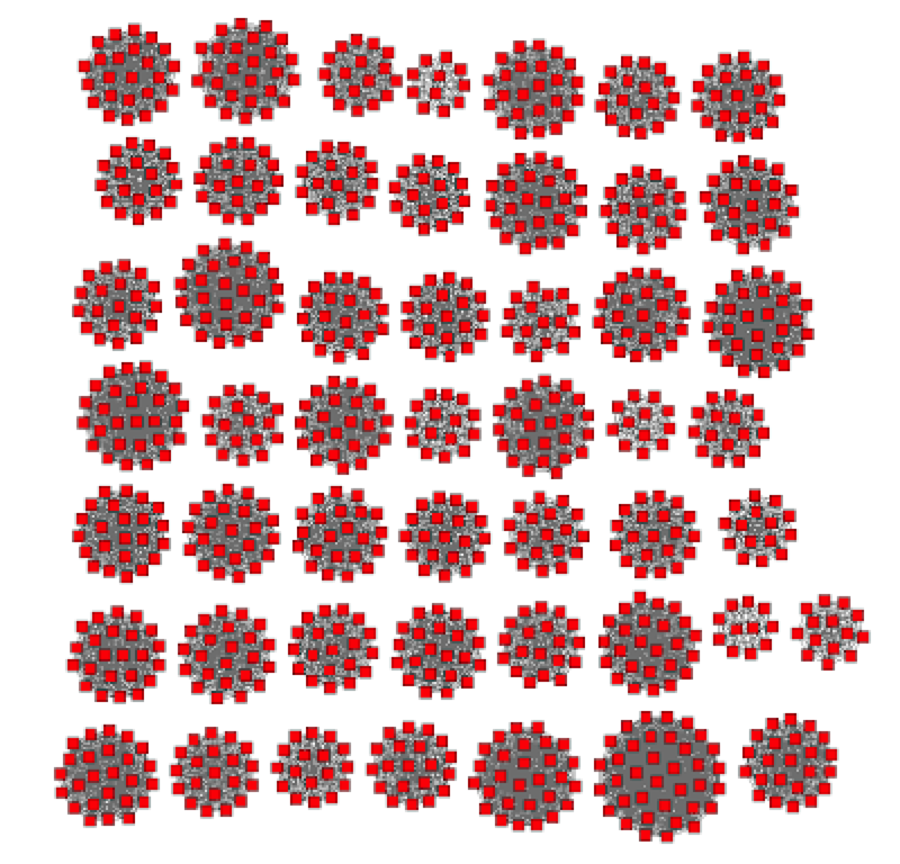
Figure 5a
Figure 5a shows board member clusters of the top 50 business organizations from several years ago. The data for the 50 Boards of Directors were sourced from the public Annual Reports of the 50 companies.
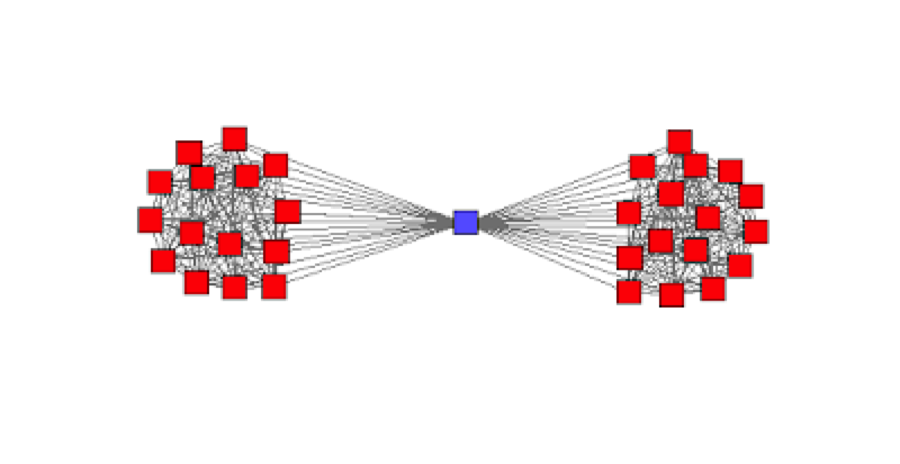
Figure 5b
There is a mostly invisible dynamic in board memberships – some board members sit on multiple boards. Figure 5b shows a board member who sits on two boards and therefore has connections to both.
It turns out that quite a few board members sit on multiple boards. The top business organisations do not have “siloed” boards; they have interconnected boards.
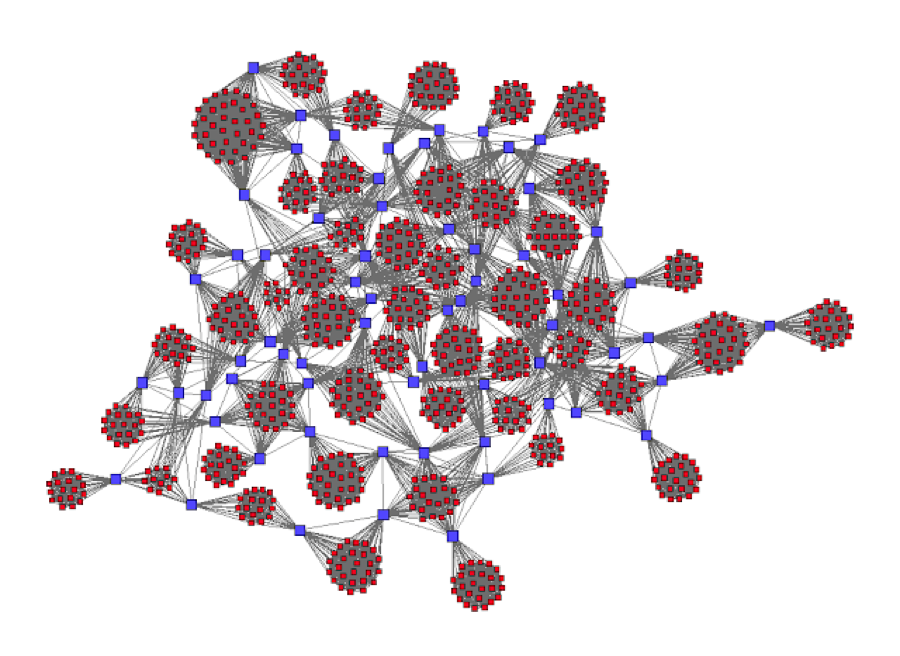
Figure 5c
The blue nodes in Figure 5c show all connectors between separate boards that provide bridges for the flow of information, knowledge, news and gossip from one board to another.

Figure 5d
Figure 5d shows just the sub-network of the connectors/bridges between the 50 boards. The nodes of various sizes are a result of a network metric showing who is most integrated (“in the thick of things”) in this network. The higher their integration, the larger their node. These nodes are well located in the network. Just like in Real Estate, the golden rule of networks is: “location, location, location”.
Network of Italy’s most influential families during the Renaissance
The next two networks were pieced together from historical documents that were centuries old. Both show key relationships in Florence, Italy during the Italian Renaissance.
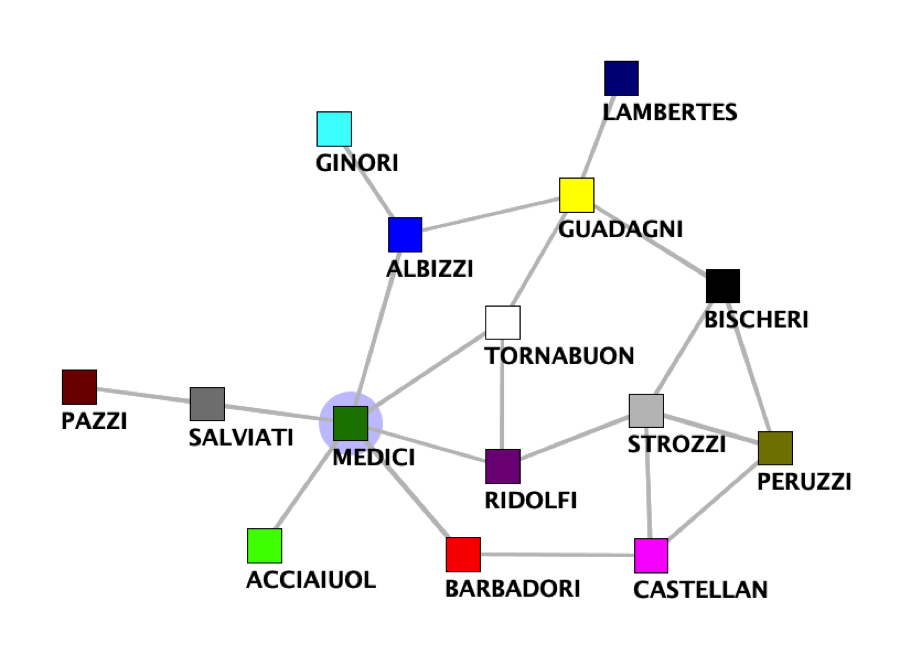
Figure 6a
The first network map, Figure 6a, shows the social connections amongst the most important families of the Italian Renaissance. Two families are connected if their sons and/or daughters married into each other’s family. We find that the Medici family is the most central node (by several network measures) in the social space at that time and place. Since this is historical information, and no longer private, the names of the families are shown.
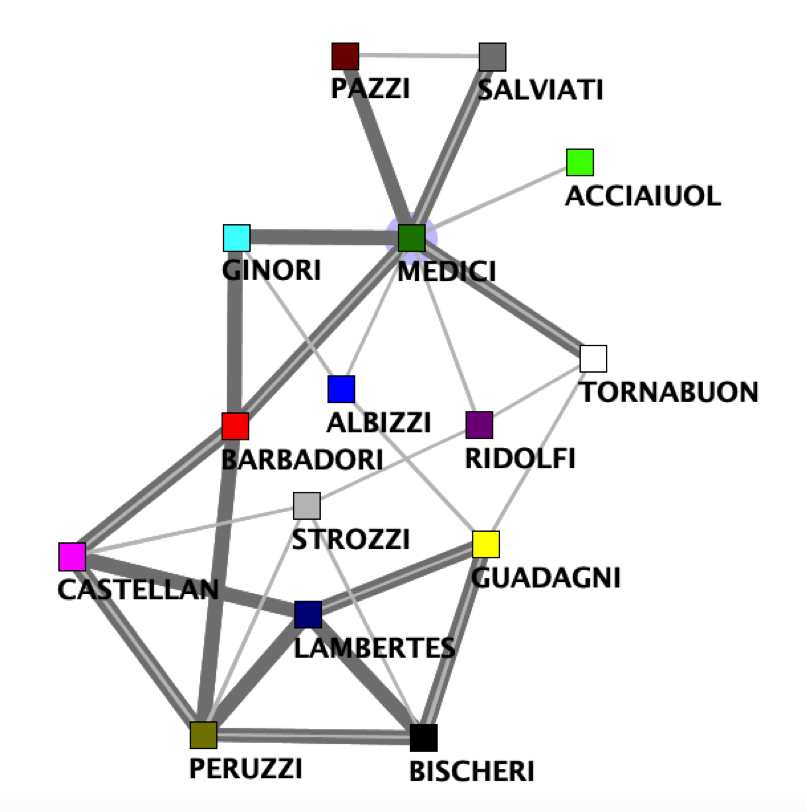
Figure 6b
The next network, Figure 6b, shows two different networks amongst the same nodes on the map. We see the previous network of social ties shown in thin, light grey lines, and we also see thicker dark grey links showing the business ties between the same families. The Medici clan remains dominant in this network, but not as dominant as in the social ties network alone.
The network in Figure 6b has a different layout then the same set of nodes in Figure 6a. Our network analysis software changes the network visualisation depending on which links are currently connected.
Visualization of criminal networks
Networks not only transfer “good things” but also “bad things” such as mis(dis)information, criminal activity, terrorist plans, and disease.
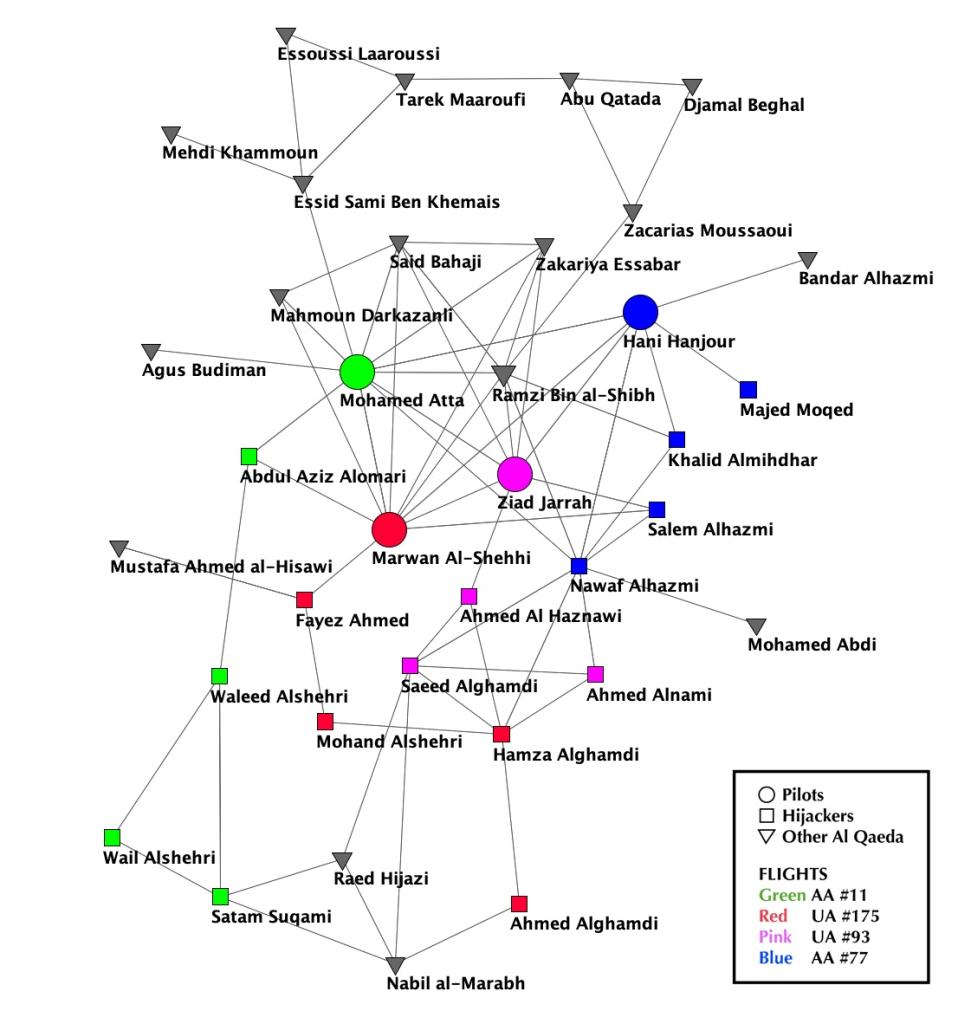
Figure 7
Figure 7 shows the terrorist network that attacked US on 11 September 2001. The map shows various node attributes of the hijackers: the planes they were on, and who the pilots were. It also shows some of the support staff the hijackers had outside of the USA who sent them money and information.
Two terrorists are connected if they had documented interactions before 11 September 2001. This map was assembled from investigative reporting on the incident, legal documents, and historical reporting of the event – all public information.
The spread of diseases through human networks
Another bad contagion that spreads through human networks is disease. Airborne contagions such as Covid and TB can spread not only between people that know each other, but between total strangers that might just momentarily share air space where someone has coughed or sneezed their germs.
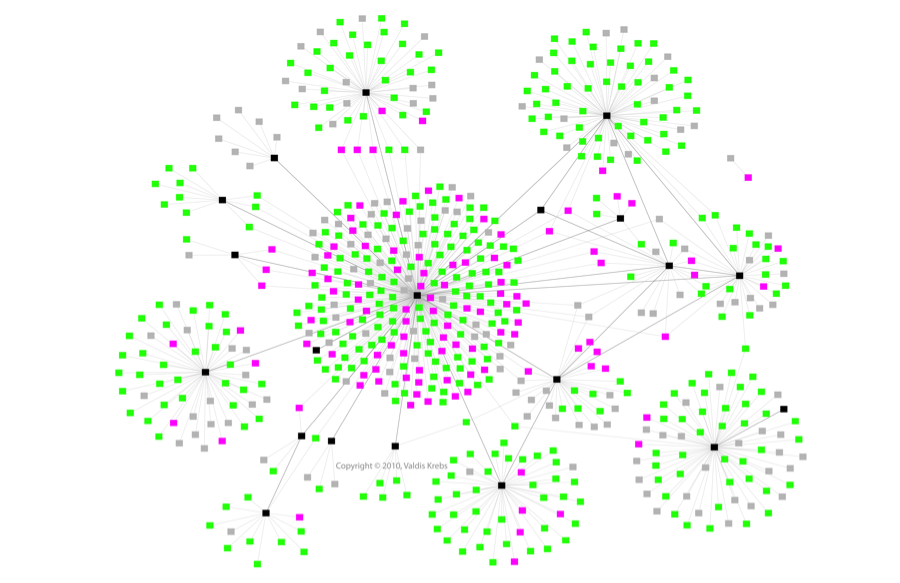
Figure 8
Figure 8 below is a map of how TB spread in a rural community in America. Two people are connected if they reported being in contact with each other. The node colours designate who was sick, who was sick AND contagious, who was tested and not sick and who was not yet tested.
The Centers for Disease Control in the US found these maps of subject contacts were much easier to use to track an outbreak than their multiple spreadsheets with contact tracing data. One network map could show critical information from dozens, or hundreds, of contact tracing spreadsheets.