Dynamics of Bone Marrow Cellularity in Paediatric B-cell Acute Lymphoblastic Leukaemia Measured by Automated Haematology Testing
Abstract
Bone marrow cellularity (BMC) or total content of nucleated cells in bone marrow (BM) is one of essential features of haemopoesis. The routine method for BMC assessment is subjective and poorly reproducible evaluation of cytological samples by microscopy. Haematological analysers could provide an objective alternative, but no results of cohort-based automated BM testing have been published.
B-cell acute lymphoblastic leukaemia (B-ALL) may be a suitable model for dynamic changes of paediatric BMC: it is the most common childhood tumour and majority of patients are treated by standardised regimen with BM examination at defined time points. The aim of the study was to use routine automated haematology for assessing BMC dynamics in paediatric B-ALL in comparison to reactive benign samples.
46 primary B-ALL cases treated by standard/median risk BFM protocol in 2011–2015 at Children’s Clinical University Hospital were analysed. BM samples had been routinely tested by microscopy and by haematological analysers Advia 2120i and Sysmex XN 1000. Overall, 208 representative analyses were available: 38 at diagnosis, 46 at treatment day 15, 45 at day 33, 40 at day 78 and 39 before reinduction. In addition, 37 non-neoplastic BM samples with BMC microscopically evaluated as “normal” were used for reference (median BMC 54.8 × 10⁹/L, range 31.5–73.1 × 10⁹/L, normal distribution of values).
Median BMC at diagnosis was 74.1 × 10⁹/L (significantly above normal, p = 0.01), at day 15 – 8.5 × 10⁹/L and at day 33 – 11.7 × 10⁹/L (both below normal, p < 0.001 and p = 0.001, respectively), at day 78 – 61.1 × 10⁹/L and before reinduction – 60.4 × 10⁹/L (both slightly above normal). BMC drop from diagnosis to day 15 was significant (p < 0.001); likewise, the increase from day 15 to day 33 (p = 0.01) and from day 33 to day 78 (p < 0.001).
The study demonstrated the validity of automated BMC testing and possible use of samples with cytologically normal BMC for reference. Potential limitations of the approach are further discussed.
Introduction
After centuries of research, human haemopoesis in bone marrow (BM) is one of the most extensively studied biologic systems (Zon, 1995). Still many questions remain, some of them due to technical reasons and ethical restrictions.
Total content of nucleated cells or bone marrow cellularity (BMC) is an important basic aspect of haemopoesis, closely related to its activation, suppression and infiltration. BMC inclusion in BM analysis report is mandatory. Dynamic changes of BMC, like in myelosuppression and subsequent regeneration, are of particular clinical interest. Routinely, BMC is subjectively assessed by microscopy of histological biopsies (as percentage of BM tissue volume occupied by nucleated cells) or of cytological material (as experience-based assessment of nucleated cells’ density on the slide) (Friebert et al., 1998; McKenzie et al., 2010). Besides being highly subjective, this evaluation is prone to technical artefacts of slide preparation.
Using automated haematological analysers for the task looks like a logical way to objectivity and standardisation. As a rule, modern systems have specialised programmes for testing BM, where BMC is reported in the quantitative form of cell count per volume, analogous to leukocyte count in peripheral blood. Tested BM suspension is homogenous and large number of events is recorded during the test, thus avoiding the main pitfalls of microscopy. Still, no comprehensive serial data on the automatically measured BMC have been published.
BMC assessment is even more complicated in paediatric patients. Haemopoesis in childhood differs from adults due to higher demand, high BM reactivity and still unfinished maturation, meaning that reference BMC data and experience obtained from adult patients are not entirely applicable in paediatric practice. Moreover, evaluation of BMC in children faces additional problems due to difficulties in acquiring material (Friebert et al., 1998; Lanzkowsky, 2011; Proytcheva, 2011, 2013).
Finally, since BM studies are performed as a part of diagnostic algorithm for marrow diseases, few samples of “normal” BM are obtained, particularly in children. All these factors make definitions of “normal” and “abnormal” BMC not strictly specified, the clinical demand notwithstanding.
Finding a model for studying treatment-related BMC dynamics presents additional problem, for different disorders and treatment modalities cause dissimilar marrow changes. Moreover, most paediatric disorders that involve haemopoesis are quite rare, so it is difficult to collect a homogenous representative patients’ cohort. B-cell acute lymphoblastic leukaemia (B-ALL) is a reasonable solution to both problems. It is the most common paediatric tumour with sufficient number of patients available, and majority of B-ALL patients receive standardised treatment that includes several BM checks at specific time points (Hunger et al., 2015; Lanzkowsky, 2011). Latvian children with B-ALL are treated according to international BFM regimen that for standard and median risk patients requires BM sampled at diagnosis and during intensive chemotherapy on the 15th, 33th, 78th day of treatment and before M-protocol/ reinduction (Möricke et al., 2008). The purpose of these repeated checks is following-up the tumour population for therapy adjustment and evaluating restitution of normal haemopoesis.
According to common cytological experience of B-ALL follow-up, initial high cellularity of blastinfiltrated BM usually drops dramatically at day 15, remains low at day 33 with subsequent regeneration by day 78. Reasonably, the automatically measured BMC should follow the same sequence.
Aim and Objectives
The aim of the study was to investigate BMC of paediatric B-ALL patients at diagnosis and in follow-up samples by automated haematology assay.
The results were compared to BM samples where cellularity had been cytologically evaluated as “normal” in order to test the validity of the approach and to objectively evaluate dynamics of BMC during treatment.
Material and Methods
Fourty six paediatric patients (age from 3 months to 17 years) treated for primary standard/median risk B-ALL in 2011–2015 at Children’s Clinical University Hospital Haematooncology Department were retrospectively included in the study. BM samples had been routinely analysed in the Hospital Laboratory by microscopy and by haematological analysers Advia 2120i (Siemens AG) in July 2011 – October 2014 and Sysmex XN 1000 (Sysmex Corporation) since November 2014, using manufacturer’s settings for BM testing. Anonymised BMC counts and cytology reports were obtained from the Laboratory LIS “Dialab” (Diamedica SIA). 208 representative analyses were available: 38 at diagnosis (peripheral blood had been used as diagnostic material in 8 patients), 46 at day 15, 45 at day 33, 40 at day 78 and 39 before reinduction.
In addition, BMC counts from 37 non-neoplastic BM samples from the same period, where BMC had been microscopically evaluated as “normal” were used for reference.
Microsoft Excel database was created for data collection and basic statistics; IBM SPSS Statistics was used for calculating correlations (Spearman rho test), differences between checkpoints and between checkpoints and “normal” group (Wilcoxon signed rank test) and normality (Kolmogorov–Smirnov test).
Results
BMC in the “normal” group was normally and uniformly distributed (Kolmogorov–Smirnov test p = 0.753 and p = 0.167, respectively) with median 54.8 × 10⁹/L, mean 53.0 × 10⁹/L and 90 % range 31.5–73.1 × 10⁹/L.
Most important findings in B-ALL patients have been summarised in Table 1.
BMC at diagnosis was significantly above that in the “normal” group. On commencing chemotherapy, it reached nadir at day 15, remained low at day 33 and then increased during regeneration of haemopoesis at day 78 and before reinduction (Figure 1). The dynamic changes were statistically significant, BMC at therapy day 15 was significantly lower than at diagnosis, at day 33 significantly higher than at day 15, at day 78 highly significantly higher than at day 33; there was no significant difference between day 78 and before M protocol (Table 1).
BMC was significantly higher than in the “normal” group at diagnosis, significantly below “normal” at days 15 and 33 and again reached levels slightly above the “normal” group at day 78 and before reinduction (Table 1).
The initial BMC at diagnosis did not correlate with further BMC levels during therapy by Spearman test, the only significant correlation found was between day 15 and day 33 (p = 0.039).
Table 1. Dynamic changes of BMC during treatment of paediatric ALL
| Time point | Diagnosis | Day 15 | Day 33 | Day 78 | M-protocol |
|---|---|---|---|---|---|
| Number of cases, n | 38 | 46 | 45 | 40 | 39 |
| Median BMC, × 109/L | 74.1 | 8.5 | 11.7 | 61.1 | 60.4 |
| Difference with normal group, p* value | 0.010 | < 0.001 | < 0.001 | NS** | 0.049 |
| Difference with previous time point, p* value | – | with diagnosis < 0.001 | with day 15 0.001 | with day 33 0.001 | with day 78 NS** |
* p – Wilcoxon signed rank test;
** NS – non-significant.
Figure 1. BMC at time points in relation to reference group*
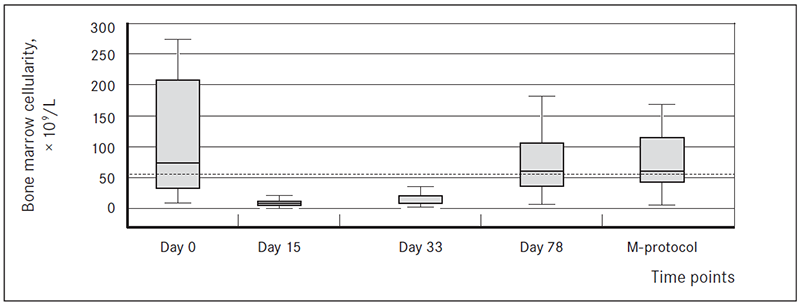
* Boxes show median, 95 % confidence interval and total range in B-ALL patients.
Dotted line represents median “normal” BMC.
Discussion
Reliable assessment of BMC is necessary for diagnostics of BM diseases, as well as for tailoring therapy and performing BM transplantation (Friebert et al., 1998; McKenzie et al., 2010; Proytcheva, 2013). Still, objective evaluation of BMC remains elusive. On the one hand, in case of significantly abnormal samples, it is easily qualitatively assessed by an experienced pathologist on cytology or histology. On the other hand, this evaluation is subjective, poorly reproducible and becomes unreliable in cases of borderline BMC. The classical work of Friebert et al. (1998) that remains the most extensive quantitative study of BMC in children, used optical histometry of trephine biopsies; but paediatric trephines are notorious for being small and prone to crush artefacts, particularly in infants.
The study demonstrated another workable approach. Haematology analysers are particularly effective in counting blood cells, being designed for the purpose. In addition, besides BMC, automated haematology provides additional valuable information on BM, like preliminary assessment of main leukocyte populations, presence of optically abnormal cells, possibility of hemodilution. Actually, the test had been initially introduced at Children’s Clinical University Hospital Laboratory with the sole purpose to calculate BMC for optimal dilution of the sample for flow cytometric analysis. It proved useful and was subsequently extended to all BM samples.
The results show that, in the absence of other options, BMC of non-neoplastic patients’ cohort evaluated as normal by an experienced cytologist could be tentatively used as reference range. We found normal distribution of BMC values in this group. In addition, there is empirical experience of BFM treatment regimen that BMC should be “about normal” at day 78 and before reinduction (Kushwaha et al., 2014; Möricke et al., 2008), just like in the present study. Still, some caution would be advised. The studied cohort is small and should be expanded to ensure precision. Microscopy was performed by a single cytologist, a panel revision would be advised to minimise subjectivity. Finally, technical considerations should be taken into account. The smear for BM cytology is prepared directly from syringe immediately after aspiration to ensure the best morphology, the rest is mixed with anticoagulant for further analysis; sometimes, additional material is aspirated. Thus, cytological slide and suspension that is tested for BMC are not the same material, in the strict sense. The rather broad range of BMC in the “normal” group may be the result of this discordance.
The use of B-ALL as a model with well-known BMC dynamics demonstrated reliability of automated BM analysis in this setting. BMC of B-ALL patients during treatment follow the empirical experience: high cellularity at diagnosis due to blast infiltration, sharp decrease during initial treatment followed by mild regeneration at day 33, then normal levels at the next two time points (Hunger et al., 2015; Kushwaha et al., 2014; Proytcheva, 2011, 2013). Both hyperplasia at diagnosis and aplasia at day 15 and day 33 statistically significantly differed from the proposed reference cohort. BMC at day 15, day 33 and day 78 was significantly different from their respective previous checkpoints, making the changes sharp and distinctive. A larger patient cohort would be necessary to define reference values of BMC for standard time points. Study prolongation to BM status during later therapy stages and at the end of treatment may be of interest.
Very high variability of BMC at diagnosis, probably due to sampling artefacts, is noteworthy; the notion could be checked by BM histology where available.
Conclusions
Automatically measured median BMC in samples with microscopically “normal” cellularity was 54.8 × 10⁹/L (90 % range 31.5–73.1 × 10⁹/L). Pending availability of a larger and better-defined pool, the cohort could tentatively serve for reference BMC in children. Moreover, the figure is near to B-ALL BMC at day 78 and before reinduction when (according to cytological experience) BM returns to its normal cellularity. Thus, the use of reactive BM for reference seems to be a workable approach. Additional material and expertise, probably through international cooperation, will be needed to exclude possible artefacts.
Using automated haematology for BMC evaluation in B-ALL patients demonstrated significant and consistent changes, well in accordance with subjective experience. BMC dropped almost 10-fold from high initial cellularity at diagnosis (median 74.1 × 10⁹/L) to the equivalent of cytological aplasia at day 15 (8.5 × 10⁹/L) and deep hypoplasia at day 33 (11.7 × 10⁹/L). Subsequent decrease of therapy intensity resulted in BM regeneration and restitution of BMC to “normal” levels (61.1 × 10⁹/L at day 78 and 60.4 × 10⁹/L before reinduction). Both the sharp drop of BMC and the steeper increase were statistically significant; that provided additional credibility to the model.
The study demonstrated that assessment of BMC by automated haematological analysis is an objective, quantitative, simple, fast and relatively cost-effective alternative to microscopic evaluation. Its limitations are related mostly to BM material acquisition.
The study results are of direct clinical value, being applicable for objective follow-up of patients during leukaemia treatment.
References
- Friebert, S. E., Shepardson, L. B., Shurin, S. B., Rosenthal, N. S., et al. Pediatric bone marrow cellularity: are we expecting too much? Journal of Pediatric Hematology/Oncology. 1998, 20 (5): 439–443.
- Hunger, S. P., Mullighan, C. G. Acute lymphoblastic leukemia in children. N Engl J Med. 2015, 373 (16): 1541–1552.
- Kushwaha, R., Kumar, A., Aggrawal, K., Nigam, N. Post chemotherapy blood and bone marrow regenerative changes in childhood acute lymphoblastic leukemia a prospective study. Indian Journal of Pathology and Microbiology. 2014, 57 (1): 72–77.
- Lanzkowsky, P. Manual of Pediatric Hematology and Oncology. 5th ed. London: Academic Press, 2011, 1054.
- McKenzie, S. B., Williams, J. L. Clinical Laboratory Hematology. 2nd ed. London: Prentice Hall, 2010, 1080.
- Möricke, A., Reiter, A., Zimmermann, M., et al. German-Austrian-Swiss ALL-BFM Study Group. Risk-adjusted therapy of acute lymphoblastic leukemia can decrease treatment burden and improve survival: treatment results of 2169 unselected pediatric and adolescent patients enrolled in the trial ALL-BFM 95. Blood. 2008, 111 (9): 4477–4489.
- Proytcheva, M. Bone marrow evaluation for pediatric patients. International Journal of Laboratory Hematology. 2013, 35: 283–289.
- Proytcheva, M. A. Diagnostic Pediatric Hematopathology. 1st ed. New York: Cambridge University Press, 2011, 588.
- Zon, L. I. Developmental biology of hematopoiesis. Blood. 1995, 86 (8): 2876–2891.