Why are human networks important? Part one
With this blog post, we begin a three-part series by network analysis expert and (R)E-TIES researcher Valdis Krebs on human relationship networks. In the first post, we explore why human networks matter and how social network analysis can help us understand them.
Networks are the social and task structures in which we spend our whole lives. Whether we are working, learning, socialising, relating, selling, trading, politicing, and most other human interactions – they all happen in networks of relationships.
Social Network Analysis (SNA) is the mapping and measuring of relationships and flows between people, groups, organizations, computers, URLs, and other connected information/knowledge entities. The nodes in network analysis are people, groups or organisations, while the links show relationships and/or flows between the nodes.
It is a common belief on the internet that social network analysis is a “new thing” – that it started after social network platforms, such as Facebook and Twitter, appeared on the scene. Not so. Social networks have been around since our ancestors lived in caves.
Early social network analysis: school children relationship map
The first real social network analysis project – initially called sociometry – happened in the last century, in 1934. Jacob Moreno, a social psychologist was studying the interactions and social circles of young school children in grades one through eight. To help him understand the complex social system in the classroom, Moreno drew sociograms showing how children were connected. He asked each child in each classroom to list the two other classmates that s/he wanted to sit next to, from that data he drew a sociogram showing the classroom social space, with node shapes indicating boys (triangles), girls (circles) and with arrowed links showing which child chose which other two children and preferred seatmates. Figure 1 shows Moreno’s sociogram of the 1st graders.
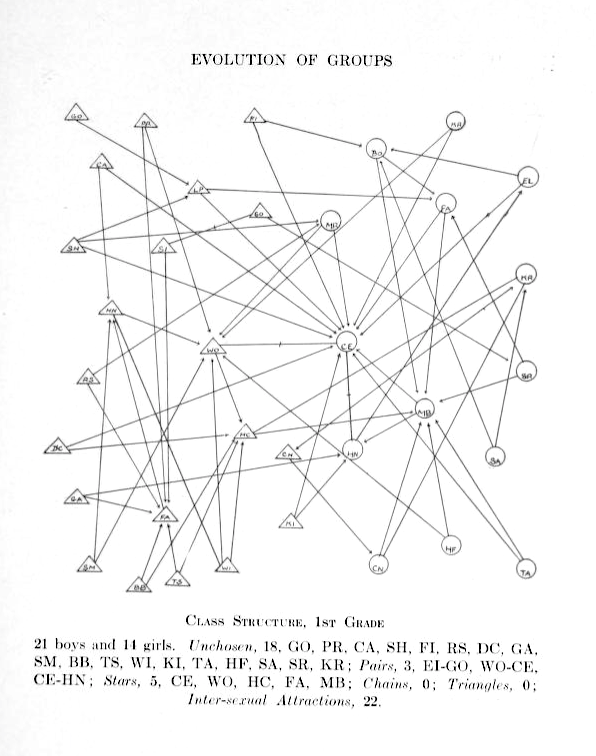
Figure 1.
Networks across management levels: the formal and the informal
Sociometry grew slowly through the middle of last century until computer programs appeared to assist sociologists and anthropologists studying human groups in the 1970s and 1980s. By the end of the 1980s the first social network analysis program for business consultants.
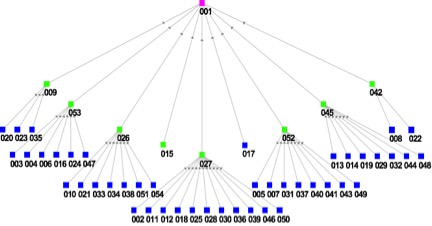
Figure 2a
Figure 2a shows an organisational hierarchy – the formal (prescribed) relations in the organization. The hierarchy shows the top three levels of management in the organization’s IT department. This data was obtained from the client’s HR department.
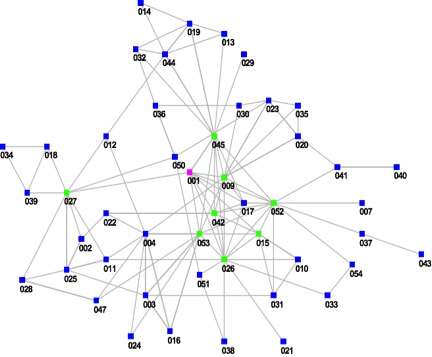
Figure 2b
Figure 2b shows the emergent work ties amongst the organizations top three levels of IT management. The client’s HR Manager using a SNA survey designed by the consultant gathered this data. Figures 2a and 2b show the same employees, just connected in two different ways in each diagram. Employee names are replaced by random numbers to maintain the employee’s privacy.
The links in the above two figures show symmetric working relationships – information and knowledge flow both ways in these relationships.
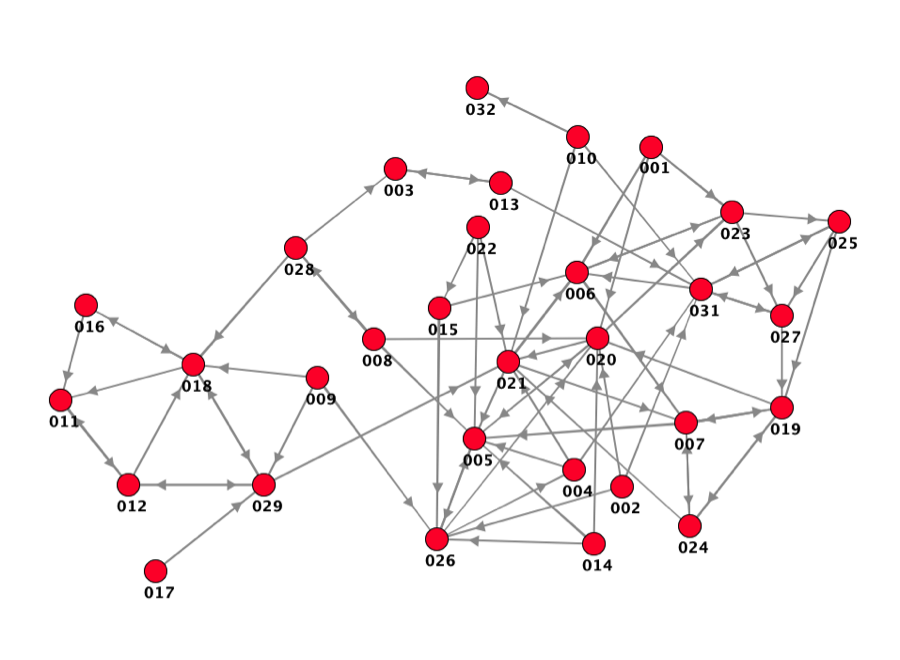
Figure 3.
Figure 3 shows a directional network. Instead of work ties we now see a network map of advice-seeking ties – who seeks out whom for advice on using a new product/method? The arrows on the network links indicate the direction of who seeks advice/info from whom. A → B reveals that A seeks advice/info from B.
In Figure 3 our eyes naturally gravitate to the node that has the most incoming arrows – who is sought out the most? Yet, our SNA metrics allow us to dig deeper. It is not just who is the most popular in the advice-seeking network that matters - also important is who is seeking the advice. A node with 5 incoming arrows from people who themselves are not sought out for advice will not be as important as other nodes with 5 incoming ties, with all incoming ties from other people, who are also sought out for advice. In an expert network, it is better to be sought out by other experts.
Document networks in European patents
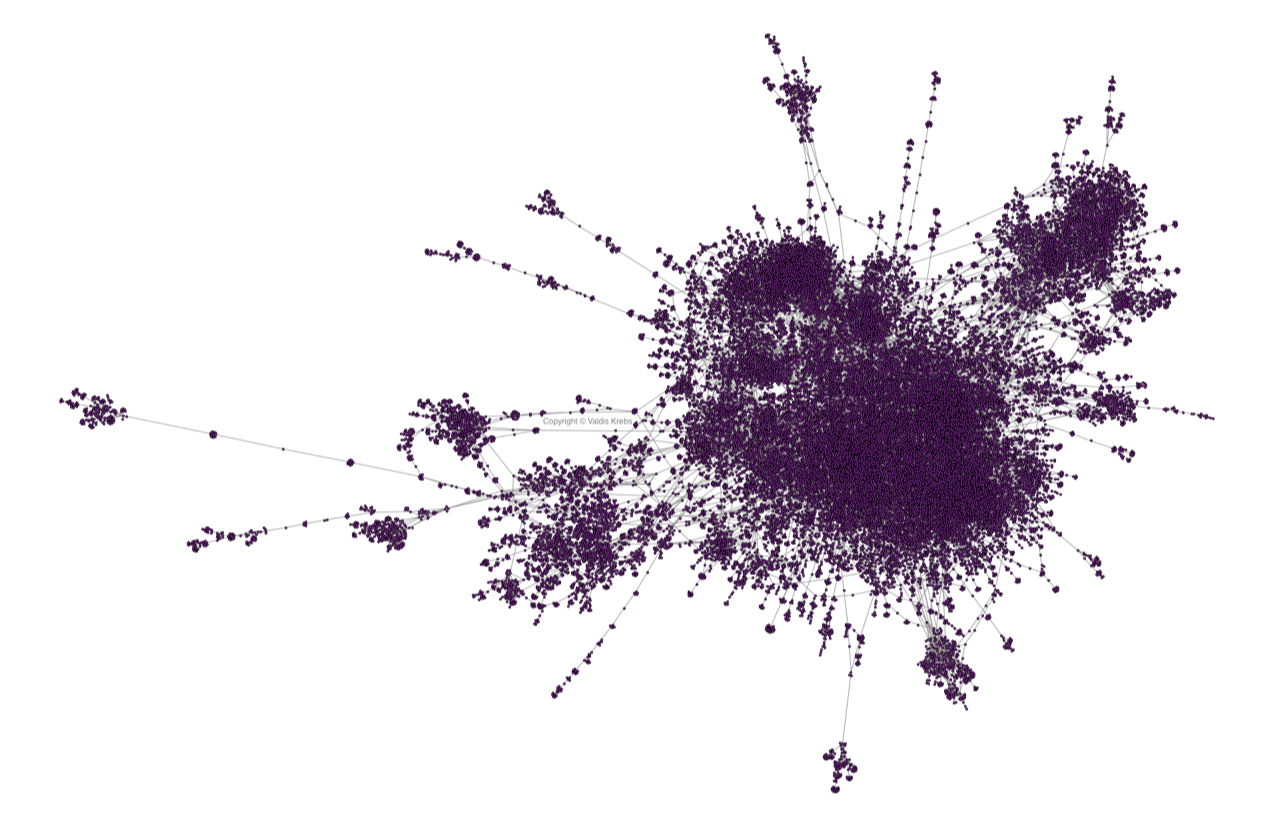
4. attēls.
In the next case the nodes are no longer people, but now they are documents. Figure 4 show a partial network of European Patents. In this network, a patent shows which previous patent(s) it cites. X → [B, C, J, R] reveals that Patent X cites previous patents B, C, J and R in its patent application.
This diagram shows emergent clustering of patent topics; a cluster of medical patents is probably separate from a cluster of software patents. Yet, as time goes by, these two clusters may slowly merge as medicine is increasingly influenced by software.