Work Ability and Stress Factors of Latvian Office Workers
Abstract
Worldwide, the number of people who are employed in offices has increased. Abilities of an office work employee have changed over the years due to changes in the working environment, equipment, work culture and responsibilities. Good work ability increases wellbeing and supports employment. The aim of the study was to investigate the subjectively estimated work ability, stress-causing factors and to determine the training programme’s (Metal Age®) impact on these stress factors and work ability of Latvian office workers.
The study was carried out using questions from General Nordic Questionnaire, Occupational Stress Questionnaire and Work Ability Index Questionnaire. Respondents were randomly divided into two groups: intervention group and control group. Both groups were interviewed twice – in March/April 2012 (first stage) and in May/June 2013 (second stage). The intervention group had a training course between the surveys using Metal Age® (ME®) method but the control group did not. Metal Age® is a structured method for developing wellbeing at work and through that improving profitability and productivity in organisations.
Latvian office workers displayed moderate and good work ability (WAI average score: 34.5–38.6). The best work ability was shown in the age group between 20 and 49 (WAI average score: 34.8–39.4); work ability decreased with age – WAI average score up to 33.6. WAI is affected by marital status and work experience, but it is not dependant on the type of work (mental or mixed mental and physical). Employees’ stress-causing factors included bad relationship with their workmates; competitive and strenuous atmosphere at workplace; psychological violence or bullying at workplace; the workplace not always being supportive and open to new ideas; suspending carrying out ongoing task because of an urgent matter; insufficient amount of discussion at workplace concerning the aims and tasks related to one’s work; possibility to accidentally ruin some valuable equipment or work result. Approximately half of the respondents considered their work being psychologically strenuous, and employees experienced stress at their workplace; the majority of employees could not relax after work. The closest relationship was observed between WAI and “get into situations that invoke negative feelings” (r = 0.26) and “carrying out ongoing tasks because of other interventions or more urgent matters” (r = −0.24).
After ME® training, some of the stress-causing factors improved: the possibility to influence the situation at a workplace; work became more autonomous; more attention was paid to the relationships with workmates at workplace; there was less hurry to finish one’s task, or suspend carrying out an ongoing task; the number of employees who consider their job being psychologically strenuous decreased.
Introduction
It is proved that work-related stress affects workers’ satisfaction with their work and productivity, their mental and physical health, absenteeism, the impact on family function and the potential for employer liability. Scientists in their research are focused on the issue how to prevent work related stress. Tennant considers that “work and family are two domains from which most adults derive satisfaction in life; equally it is a common source of stressful experiences” [1].
The forms and conditions of work have changed during the past few decades. Physical work has shifted more towards mental work that increasingly involves working in offices. The changes in the functional capacity knowledge and attitudes of workers are reflected in the content of work ability. For work ability improving and developing is necessary knowledge on the dimensions of work ability in modern society [2].
Worldwide, millions of office workers work with computers. Reports of adverse health effects due to computer usage have received considerable media attention. The literature review summarises the evidence for the relationship between the duration of work time spent using a computer and the incidence of hand-arm and neck-shoulder symptoms and disorders as well as reduction in work ability [3]. Population’s work ability has changed over the years due to changes in working life, public health, structure of the population, culture and societal norms. Comprehensive and up-to-date knowledge on different dimensions of work ability is essential for the promotion of longer careers, employment growth and wellbeing of the population of working age. Good work ability increases wellbeing and supports employment. One of the problems in current industrialised world is early retirement. Despite increased life expectancy and improved health in communities, in recent decades in many European countries the period of people’s active work life has decreased [4]. Improvement of work ability is one of the most effective ways to enhance the ability and prevent disability and early retirement [5, 6]. Work ability is defined as the ability of a worker to perform their job, taking into account how demanding the work is, its physical and mental conditions [7].
In order to increase work participation and prolong the working life among workers, the concept of work ability was developed in the early 1980s in Finland, and was later adopted in different European and Asian countries [8–11]. The Work Ability Index (WAI) is by far the most used, and well-accepted instrument to measure work ability [12]. WAI has demonstrated the possibility of wide application by its availability in 24 languages and for different professions [12–24].
Work ability is built on the balance between a person’s resources and work demands. The bases for work ability are health and functional capacity, at the same time, work ability is also determined by professional knowledge and competence (skills), values, attitudes, and motivation, and work itself [25]. Improvement of work ability is one of the most effective ways to enhance the ability and prevent disability and early retirement. Few studies have addressed determinants of work ability and stress factors at work. Sjögren-Rönkä showed that low stress at work and better self-confidence were directly related to higher work ability [26]. Job experience and satisfaction also associated with good work ability among office workers [27]. The improvement of work ability is closely linked with an improvement in the quality of job and life. The quality of life can be defined as a picture of a particular fragment of one’s life (e.g., professional life) in comparison to an ideal model including less stressful work environment. The quality of life and work ability in various chronic diseases has been the subject of many scientific publications [28, 29]. However, knowledge of the determinants of work ability and stress factors are not sufficiently widely studied.
Aim
The aim of this study was to investigate the subjectively estimated work ability, the stress-causing factors and to determine the training programme’s (Metal Age®) impact on these stress factors and work ability of Latvian office workers.
Material and methods
This study was carried out in the frame of Interreg 4A project “Workability and Social Inclusion”. The Work Ability and Social Inclusion (WASI) project is mainly based on Metal Age® (ME®) method, which was developed to increase wellbeing at work, including measuring the effects of intervention on organisational leadership and stress management. Metal Age® is a structured method for developing wellbeing at work and through that improving profitability and productivity in organisations. The Metal Age® method brings to workplaces specific, tailored and practical actions for developing the wellbeing among the personnel. An important part of the Metal Age® method is ensuring the continuity of the development process through follow-up sessions [30].
Altogether 636 respondents from 13 companies from Latvia were invited to take part in the survey. Respondents were randomly divided into two groups: intervention group and control group. Both groups were interviewed twice – in March/April 2012 (first stage) and in May/June 2013 (second stage). The intervention group had a training course between the surveys using Metal Age® (ME®) method, but the control group had not.
According to Statistical classification of economic activities in the European Community (NACE Rev. 2.), two of the companies work in the field of financing and insurance, two in manufacturing of food products, three – in public administration and defence sector, two – in communications (radio broadcasting and telecommunications), two – in transport industry and one in education sector. All job tasks of the respondents involved only or mostly office work with ICT and customers. 424 respondents’ answers were used for this study (response rate 66.7 %). 33.3 % had a lot of missing data, and they were excluded from the study. The study sample included the selection of participants who responded to all the survey questions: 212 answers of all participants – the intervention group and 212 – the control group. The participation in the study was voluntary.
The results obtained in this study were analysed within each group comparing the results in two survey periods.
Approval was obtained from the Ethics committee.
Questionnaire. The questionnaire has been an important tool in research on psychological and social factors at work. Furthermore, the questionnaire is a common tool in organisational development at worksite level.
For the study, respondents’ answers from the 3 questionnaires were used:
- General Nordic Questionnaire (QPSNordic) – 8 questions – “Leadership”.
- Occupational Stress Questionnaire (OSQ) – 33 questions and
- Work Ability Index Questionnaire (WAI) – 23 questions [11, 31, 32].
The Questionnaire was modified and adapted for office workers. It contains general information – demographic data (age, gender, marital status, education, work experience, type of work) and 41 questions about stressors in the following groups: modifying factors/resources at work, leadership, supervision, social relations and esteem, workplace atmosphere, work demands, responsibility (hazards) and environment, stress and wellbeing, need for support and interventions in job. Respondents were offered the following answers: “always”, “quite often”, “often”, ”time to time”, “rather seldom”, “never”. In Occupational Stress Questionnaire, frequencies analysis answers were grouped in two groups: “1 – not stressful” and “2 – stressful”.
The WAI is a self-administered questionnaire used in clinical occupational health and research to assess work ability during health examinations and workplace surveys. The WAI can be used for individual employees and groups of workers.
The WAI is an assessment of the ability of a worker to perform his/her job, taking into account the specific psychosocial and physical work related factors, mental and physical capabilities, and health. The index consists of a questionnaire on physical and mental demands of an individual in relation to their work, diagnosed diseases and limitations in work due to disease, sick leave, work ability prognosis, and psychological resources [12].
The work ability index (WAI) consists of the following seven items and range from 7 to 49 points:
- Current work ability compared with the lifetime best comprises the work ability score that is often used as a separate indicator of work ability and has been described above (0–10 points).
- Work ability in relation to the demands of the job (2–10 points).
- Number of current diseases diagnosed by a physician (1–7 points).
- Estimated work impairment due to diseases (1–6 points).
- Sick leave during the past year (1–5 points).
- Own prognosis of work ability two years from now (1, 4 or 7 points).
- Mental resources (1–4 points).
The work ability index is calculated by summing the points of the seven items (possible score ranging between 7 and 49 points). The index can be divided into four classes represented in the table below.
Table 1. Work ability index distribution
| Points | Work ability | Objective of measures |
|---|---|---|
| 7–27 points | Poor | Restore work ability |
| 28–36 points | Moderate | Improve work ability |
| 37–43 points | Good | Support work ability |
| 44–49 points | Excellent | Maintain work ability |
For easier data editing, subjects at or below 36 points were classified as having low work ability and they need to improve, subjects at or above 37 points classified as having satisfying work ability.
Results were analysed using IBM SPSS-20 statistical package. P values under 0.05 were considered significant; however, p value under 0.1 was taken into account as close to statistical credibility. Descriptive statistics were used to describe the characteristics of the study groups, included the analysis of age, gender, marital status, education, work experience and work type. Spearman correlation analysis was performed for WAI and stress questions. Wilcoxon or related t-test was used to compare related samples depending on data distribution. Pearson’s Chi square test for the comparison of independent categorical variables or McNemar test for related samples was used.
Results
Characteristics of the study groups (control and intervention) are shown in Table 2.
Both study groups are similar in age, gender, education and type of work. In the intervention group 68.9 % subjects who responded were women and in the control group – 69.3 %. The smallest number of people was in the age group > 60 years, 11 and 13 individuals as well as groups who live in divorced or widowed circumstances.
Most of participants had higher education, the intervention group – 83.5 % and the control group – 82.1 %. Individuals who participated in the study had a relatively small length of service – up to 9 years (~ 67 %), of 10–19 years (~ 26 %). 88.7 % of the intervention group respondents and 89.6 % control group respondents noted that they performed mental work, ~ 10 % in both groups performed a mixed-type work and only 1 person performed physical work.
Work ability index (WAI). Both groups (control and intervention) were interviewed in two periods. For the intervention group, the second period was after ME® training. Results of average WAI in the control and intervention group were compared in each group. The average work ability in first survey period for both groups was moderate (respectively, m = 35.3; SD = 3.2 and m = 34.5; SD = 4.8). After the second survey period, the average WAI was changed to statistically significant for the control group (m = 44.8; SD = 1.0) and for the intervention group (m = 37.0; SD = 5.6) (p < 0.001).
Distribution in work ability index for all workers is represented in Table 3. WAI results in the control group in the first period varied between 25 and 42 (excellent – 0 % from all respondents, good – 33.0 %, moderate – 64.6 %, poor – 2.4 %); in the intervention group it ranged between 19 and 48 (excellent – 1.9 % from all respondents, good – 26.4 %, moderate – 63.2 %, poor – 8.5 %).
Distribution of respondents in WAI groups (excellent, good, moderate, poor) changed in the second survey period. WAI results in the control group in the second period varied between 24 and 47 (excellent – 18.4 % from all respondents, good – 47.2 %, moderate – 31.2 %, poor – 3.3 %); in the intervention group it ranged between 19 and 49 (excellent – 9.4 % of respondents, good – 49.1 %, moderate – 33.5 %, poor – 8.0 %).
Table 4 shows work ability index depending on age, marital status, education and work experience and type of work in control and intervention groups (both periods). There were no statistically significant changes in the work ability to the mentioned indicators in the control group in the first and second stage. The exceptions are the respondents with secondary and special education, which increased WAI during the second stage.
Working ability of the respondents of the intervention group had a statistically significant increase, depending on education, marital status and work experience (< 9 years) after ME® training period.
Table 2. Characteristics of the studied groups
| Parameters | Control group | Intervention group | ||
|---|---|---|---|---|
| Total | n = 212 | 100 % | n = 212 | 100 % |
| Sex: | ||||
| women | 147 | 69.3 | 146 | 68.9 |
| men | 65 | 30.7 | 66 | 31.1 |
| Age group: | ||||
| < 29 | 72 | 34.0 | 79 | 37.3 |
| 30–39 | 68 | 33.1 | 62 | 29.3 |
| 40–49 | 25 | 11.8 | 27 | 12.7 |
| 50–59 | 34 | 16.0 | 33 | 15.6 |
| > 60 | 13 | 6.1 | 11 | 5.2 |
| Marital status: | ||||
| married or cohabiting | 142 | 67.0 | 141 | 66.5 |
| single | 43 | 20.3 | 39 | 18.4 |
| separated, divorced, widowed | 27 | 12.7 | 32 | 15.1 |
| Education: | ||||
| secondary and special education | 38 | 17.9 | 35 | 16.5 |
| higher education | 174 | 82.1 | 177 | 83.5 |
| Work experience, years: | ||||
| < 9 | 142 | 67.0 | 141 | 66.5 |
| 10–19 | 55 | 25.9 | 54 | 25.5 |
| 20–29 | 8 | 3.8 | 11 | 5.2 |
| 30–39 | 2 | 0.9 | 3 | 1.4 |
| 40 and > 50 | 5 | 2.4 | 3 | 1.4 |
| Type of work: | ||||
| mental work | 190 | 89.6 | 188 | 88.7 |
| physical work | 1 | 0.5 | 1 | 0.5 |
| mixed work | 21 | 9.9 | 23 | 10.9 |
Table 3. WAI scores distribution in the control and intervention group
| WAI categories | First period | Second period | |||||||||
|---|---|---|---|---|---|---|---|---|---|---|---|
| WAI (± SD) | min | max | n | % | WAI (± SD) | min | max | n | % | ||
Control group | Poor | 26.0 (1.4) | 25.0 | 27.0 | 5 | 2.4 | 24.7 (1.2) | 24.0 | 26.0 | 7 | 3.2 |
| Moderate | 33.9 (2.0) | 28.0 | 36.0 | 137 | 64.6 | 33.7 (2.1) | 29.0 | 36.0 | 66 | 31.2 | |
| Good | 38.5 (1.6) | 37.0 | 42.0 | 70 | 33.0 | 39.6 (2.0) | 37.0 | 43.0 | 100 | 47.2 | |
| Excellent | ― | ― | ― | ― | ― | 44.8 (1.0) | 44.0 | 47.0 | 39 | 18.4 | |
| Intervention group | Poor | 23.3 (2.5) | 19.0 | 26.0 | 18 | 8.5 | 24.5 (3.4) | 19.0 | 27.0 | 17 | 8.0 |
| Moderate | 33.7 (2.3) | 28.0 | 36.0 | 134 | 63.2 | 33.8 (1.9) | 29.0 | 36.0 | 71 | 33.5 | |
| Good | 38.8 (2.0) | 37.0 | 43.0 | 56 | 26.4 | 39.6 (2.0) | 37.0 | 43.0 | 104 | 49.1 | |
| Excellent | 46.0 (2.8) | 44.0 | 48.0 | 4 | 1.9 | 46.0 (1.9) | 44.0 | 49.0 | 20 | 9.4 | |
Table 4. WAI of the control and intervention group
| Parameters | Control group, first period, WAI (± SD) | Control group, second period, WAI (± SD) | p | Intervention group, first period, WAI (± SD) | Intervention group, second period, WAI (± SD) | p |
|---|---|---|---|---|---|---|
| Age group: | ||||||
| < 29 | 35.2 (4.8) | 36.1 (5.8) | NS | 33.8 (4.8) | 38.8 (5.0) | p < 0.01 |
| 30–39 | 68 | 37.0 (6.1) | NS | 35.6 (3.8) | 37.3 (4.4) | NS |
| 40–49 | 25 | 39.4 (4.2) | NS | 35.2 (5.4) | 38.2 (4.7) | NS |
| 50–59 | 34 | 38.7 (4.4) | NS | 33.6 (4.2) | 36.1 (4.4) | NS |
| > 60 | 13 | 36.5 (6.5) | NS | 34.0 (2.2) | 37.7 (6.5) | NS |
| Marital status: | ||||||
| unmarried or cohabiting | 35.6 (4.0) | 37.1 (6.1) | NS | 32.6 (5.1) | 37.6 (3.6) | p < 0.001 |
| married | 35.0 (4.2) | 37.2 (5.3) | NS | 35.0 (4.6) | 37.0 (5.6) | p < 0.01 |
| unmarried but co-habiting | 35.6 (3.0) | 38.0 (5.1) | NS | 35.8 (3.4) | 40.1 (5.0) | p < 0.001 |
| separated | 34.2 (4.1) | 33.2 (9.0) | NS | ― | ― | |
| divorced | 35.5 (2.7) | 38.9 (5.6) | NS | 32.3 (4.3) | 36.6 (2.6) | p < 0.01 |
| widow/widower | 34.5 (0.7) | 34.5 (6.4) | NS | 34.0 (1.0) | 40.3 (3.2) | p < 0.04 |
| Education: | ||||||
| secondary and special education | 35.1 (4.5) | 39.3 (4.5) | p < 0.03 | 34.8 (4.6) | 38.6 (4.6) | p < 0.05 |
| higher education | 35.3 (3.3) | 36.8 (4.8) | NS | 34.5 (4.4) | 37.1 (5.1) | p < 0.001 |
| Work experience, years: | ||||||
| < 9 | 35.4 (3.6) | 37.0 (5.8) | NS | 33.6 (4.7) | 38.2 (5.2) | p < 0.001 |
| 10–19 | 34.9 (4.6) | 38.0 (4.8) | NS | 37.0 (3.3) | 37.5 (5.4) | NS |
| 20–29 | 35.6 (2.3) | 39.5 (4.8) | NS | 35.0 (1.8) | 37.6 (4.8) | NS |
| 30–39 | 35.5 (3.5) | 31.0 (3.8) | NS | 35.2 (5.0) | 38.4 (4.6) | NS |
| 40 and > 50 | ― | ― | 37.5 (2.8) | 34.5 (2.1) | NS | |
| Type of work: | ||||||
| mental work | 35.2 (3.6) | 37.3 (5.3) | NS | 34.4 (4.6) | 37.9 (5.1) | NS |
| physical work | ― | ― | ― | ― | ― | ― |
| mixed work | 35.5 (4.9) | 37.0 (8.1) | NS | 36.0 (2.8) | 38.3 (4.1) | NS |
NS – not statistically significant.
Stress factors. Analysis of QPSNordic, eight questions regarding leadership’s attitude towards an employee as a cause of stress, showed that in between 80.6 % and 93.5 % of control group cases superiors encourage to participate in important decisions, help to develop employees’ skills, tackle problems as soon as they surface, distribute work and treat workers fairly and impartially. However, superiors do not encourage participating in important decisions for 25.8 % of employees and the relationship between superiors and employees may be the cause of stress for 29.3 % of respondents. A similar situation was also observed in the second period. Also in the intervention group, leadership’s attitude to employees does not cause stress both in the first and in the second period (before and after the ME® training). More than 85 % (85.9 %–97.0 %) of employees believe that their leadership helps to build good working relationships. Before the training, 23 % of employee’s answers showed that the leadership of immediate superior did not encourage their participation in important decisions, while after the training the number increased to 25 %. If before the training relationships with the leadership was the cause of stress for 22 % of the employees, then after the training, it was the cause of stress for 26.8 % of employees.
Analysis of the control group’s OSQ 33 stress characterising questions in the first period revealed that there are several factors (13) which may be the reason for stress at workplace (the score higher than 10 %); 16.1 % of employees consider their relationship with colleagues as being rather negative; not highly positive evaluation of the family regarding the job – 11 %; the atmosphere at workplace is competitive and stressful – 29 %; the workplace is not always encouraging and open to new ideas – 29 %; sometimes there is psychological violence or bullying at workplace – 30 %; there are difficult tasks to perform – 15.1 %; there is a hurry to finish one’s task – 41.3 %; they must suspend carrying out an ongoing task – 41.9 %; insufficient amount of discussion at a workplace in relation to aims and objectives of work tasks –16.1 %; they can accidentally ruin some valuable equipment or work result – 23.3 %; more than a half of employees have a mentally strenuous job – 60.2 %; 41.9 % experience stress at workplace, and the majority – 76.3 % cannot relax after work.
During the second period, the answers to questions regarding stress-causing factors improved in three cases: in relationships with colleagues (6.6 %) and family (6.5 %), and in question about strenuous workplace atmosphere (22.8 %). However, some of the indicators declined: there is less possibility to influence the situation at workplace – 16.1 %; decreased employee’s autonomy – 25.8 %; there are situations at workplace which cause indignation, fear, shame – 12.9 %; there is insufficient amount of discussion regarding work tasks – 22.6 %; there is a possibility to ruin some valuable equipment or work result – 32.2 %.
Comparison of answers regarding the stress-causing factors in first and second period in the control group shows that there is a statistically significant difference (p < 0.05) between answers to 17 questions.
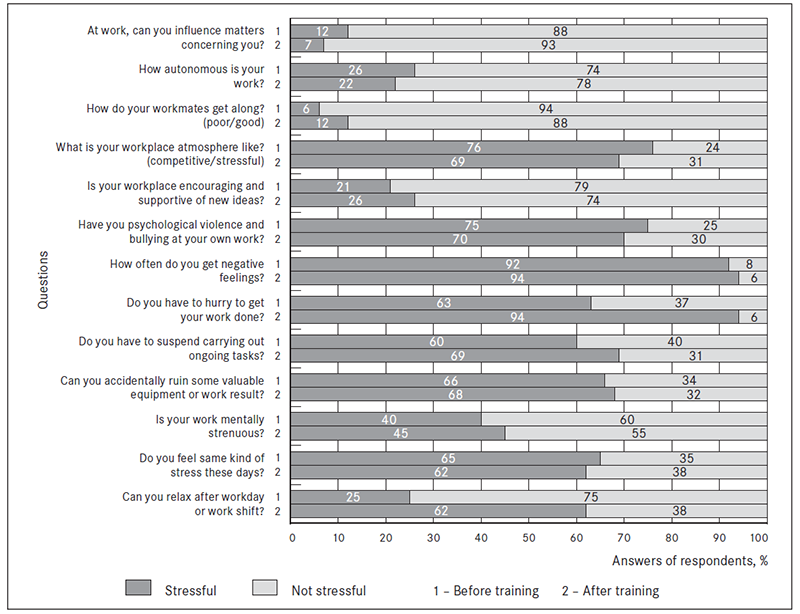
Analysis of OSQ 33 stress questions in the intervention group in the first period (Figure 1) yielded similar to the control group results: 12 factors which may cause stress at workplace may include: there is no possibility to influence the situation at workplace – 12.1 %; work is not autonomous – 26 %; strenuous atmosphere at workplace – 24 % and workplace is not encouraging and supportive of new ideas – 21 %; there is psychological violence and bullying at workplace – 25 %; there are difficult stages of work tasks – 14 %; there is a need to hurry and carry out one’s tasks – 37 % and carrying out the ongoing task must be suspended – 40 %; there is a possibility to accidentally ruin some valuable equipment or work result – 34 %; more than half of respondents have mentally strenuous work – 60 %; 35 % experience stress at workplace, and the majority – 75 % cannot relax after work.
During the second period, answers to seven questions regarding stress-causing factors improved: possibility to influence situation at workplace increased by 5.1 %; work autonomy increased by 78.2 %; more attention is paid to relationships with workmates – 11.9 %; only 6 % of employees consider that they could have better relationships with their workplace, and there is need to hurry in their job; and the ongoing task must be suspended – 30.7 %; there is possibility to accidentally ruin some valuable equipment or work result – 31.6 %; there was also a decrease in the number of employees whose job is mentally strenuous – 55.4 %. While the atmosphere at a workplace became slightly more strenuous/competitive – 30.7 %, the workplace is not so open and supportive of new ideas – 74.3 %; psychological violence increased – 29.7 % and employees experience stress – 38 %, and cannot relax after work – 62 %. The comparison of the answers to the questions regarding stress-causing factors in the intervention group in first and second period (before and after the ME® training) was found statistically significant (p < 0.05) in 14 questions.
Figure 1. Answers of respondents (%) on stress issues according to OSQ in the intervention group (answers were grouped in two sections: “not stressful” and “stressful”)
For correlation analysis between the WAI and stressful factors, determination of Spearman’s correlation coefficient was used. A statistically significant correlation was not found between influences of superiors upon important decision-making, assistance in the development of skills, work organisation, etc. (QPSNordic questionnaire) and work ability in both control and intervention groups in neither first nor second period.
The analysis of correlation between work ability and stress factors in the control group, according to OSQ, showed that there is a statistically significant correlation only in two cases in the first period, there was no correlation found after the second period (Table 5).
In the intervention group, statistically significant correlation was found between work ability and stress-causing factors, although it is weak (Table 6).
No correlation in the control and intervention group between work ability and relationships with immediate superior (8 questions) was found: does your immediate superior encourage to participate in important decisions; to speak up, when you have different opinions; help develop your skills; distribute work fairly and impartially; treat workers fairly and equally; is the realationship between you and your immediate superior a source of stress to you.
No correlation was found between work ability and OSQ stress questions about modifying factors/ resources at work (4 questions); social relations and esteem (5 questions); workplace atmosphere (2 questions); leadership and supervision (2 questions); perceived environment (7 questions); responsibility (hazards) and environment (2 questions); work strain, stress and wellbeing (5 questions); need for support and interventions in your job (1 question).
Table 5. Correlation between work ability and stress factors in first period in the control group
| Questions* | Spearman correlation coefficient | p |
|---|---|---|
| Do workmates provide help and support when needed | 0.22 | 0.03 |
| How often do you, at your work, get into situations that invoke negative feelings such as indignation, hate, fear or shame in your mind? | 0.26 | 0.10 |
* Only statistically significant values are shown in the table.
Table 6. Correlation between work ability and stress factors before and after ME® training in the intervention group
| Questions* | Spearman correlation coefficient | p | |
|---|---|---|---|
| First period | Second period | ||
| At work, can you influence matters concerning you? | ― | -0.21 | 0.04 |
| How often do you, at your work, get into situations that invoke negative feelings such as indignation, hate, fear or shame in your mind? | -0.18 | ― | 0.08 |
| Do you have to suspend carrying out ongoing tasks because of other intervening or more urgent matters? | -0.24 | ― | 0.02 |
| Are you enthusiastic about your job? | 0.21 | ― | 0.04 |
| What is your state of health compared with that of other people of your age? | ― | 0.27 | 0.01 |
| How satisfied are you with your present job? | ― | -0.23 | 0.03 |
* Only statistically significant values are shown in the table.
Discussion
The concept of work ability relates to the capacity a worker has to perform his work tasks, given his work demands, health status, and physical and mental abilities and may be considered as a measure of functional aging [33]. Work, ability which is regarded as a dynamic process of human resources in relation to work, is influenced by a number of factors, which include socio-demographic characteristics, lifestyle, the aging process, and work demands [27]. Work ability varies in different factors of the population.
In the present study, 424 employees’ answers about work abilities in 13 office companies were assessed; aged 19–74; ~ one-third were females. 66.8 % of the respondents were co-habiting or married. 82.8 % of the respondents had higher education. The majority of the employees (66.7 %) were with little work experience – up to 9 years. Due to the nature of their jobs, 89 % were engaged in mental work. The respondents were divided into two groups: the control group and the intervention group. Both groups were interviewed twice. Intervention group had a training course using Metal Age® method between surveys but the control group did not.
WAI was assessed during the first and second period.
According to WAI analysis, majority of our study population showed moderate or good work ability – in the control group average WAI = 35.3; in intervention group WAI = 34.5. The obtained WAI divided by class is as follows in control group: excellent – 0 % of all respondents, good – 33.0 %, moderate – 64.6 %, poor – 2.4 %; in intervention group: excellent – 1.9 % of all respondents, good – 26.4 %, moderate – 63.2 %, poor – 8.5 %. For those whose work ability index is moderate (score 28–36) improvement of work ability is recommended. Workers with good work ability index (score 37–43) should receive instructions on how to maintain their work ability. Those whose work ability is excellent (44–49) should also be informed which work and life style factors maintain work ability and which factors weaken it [4].
During the second period, WAI was determined after holiday period and average WAI increased in both groups – in the control group WAI = 38.6 (compared to WAI = 35.3 in the first period), in the intervention group WAI = 37.0 (compared to WAI = 34.5 in the first period). The WAI score difference in each group between two survey periods was still statistically significant (p < 0.001).
Distribution of respondents in WAI groups (poor, moderate, good, excellent) changed in the second survey period: in the control group varied from 24 to 47 (excellent – 18.4 % of all respondents, good – 47.2 %, moderate – 31.2 %, poor – 3.2 %); in the intervention group it ranged between 19 and 49 (excellent – 9.4 % of all respondents, good – 49.1 %, moderate – 33.5 %, poor – 8.0 %).
Changes could be associated with a decrease in the number of persons with moderate work ability and increase in the number of employees with good and excellent work ability. After the training, WAI increased in the age group up to 29 years of age, as well as depending on the marital status and education in the intervention group. The control group did not display such changes. The studies carried out in other countries show that office workers display excellent and good working abilities [3, 27]. According to Finnish researchers’ data, mostly people of working age evaluate their work ability as good [10].
Results of the present study indicated that WAI score was moderate and good (WAI ~ 34–39) for employees with secondary and special education or higher education that is similar to research on nurses by Golubic et al. that suggests that respondents with higher educational levels have better work ability than their colleagues with lower educational level [34]. Young and well-educated people perceive their work ability to be better than those who are older or have less education. Moreover, widows and single or divorced men report more problems concerning work ability than those who are married, white-collar job workers report better work ability than blue-collar job employees. Good work ability is evident only among those with higher education, physically light work and good health [2, 8, 9, 10].
The present study identified the major groups of occupational stressors in the control and intervention groups. In the control group there was identified “perceived environment” – six stressors, “modifying factors/resources at work” two stressors, “social relations and esteem” – two stressors, “workplace atmosphere” – two stressors, “responsibility (hazards) and environment” – two stressors, “stress and wellbeing” – two stressors, “leadership and supervision” – 0 stressors. In the intervention group, slightly different results were obtained: “perceived environment” – three stressors, “modifying factors/resources at work” – two stressors, “workplace atmosphere” – two stressors, “responsibility (hazards) and environment” – two stressors, “stress and wellbeing” – two stressors, “social relations and esteem” – one stressor “leadership and supervision” – 0 stressors.
After ME® training, possibility to influence the situations at a workplace increased by 5.1 % in the intervention group; work autonomy increased by 4.2 %; increase in paying attention to relationship with workmates was 50 %. There was an increase in the number of respondents who consider that the relationships at workplace should be improved; there is no need to hurry to finish their job and suspend carrying out ongoing tasks; decreased chance accidentally ruin some valuable equipment or the work result; there was also a decrease in the number of employees who considered their work as mentally strenuous and stressful.
Poor communication with colleagues was one of the common stressors at work. Good communication can protect from harmful effects of other stressors and can contribute to better safety at work. The concept of work ability presumes a modern concept of human ability for work conditions to worker’s abilities and capabilities. A worker’s psychophysical abilities change with time [35].
Some studies show that stress at work can reduce safety of workers, and work ability becomes lower with age and working time [36]. The present study showed a statistically significant Spearman correlation in the intervention group between different stress-causing factors, e.g. “how often do you, at your work, get into situations that cause negative feeling”; “do you have to suspend carrying out ongoing tasks because of other intervention or more urgent matters” and work abilities prior to the training. However, this correlation was weak. Also after the training, there was a weak correlation between stress factors and work abilities: “at work, can you influence matters concerning you”; “state of health compared with that of other people”; “satisfaction with present job”.
Conclusions
- The Work Ability Index is a simple, cheap and effective method, which helps to assess the overall situation in an organisation, employees’ work abilities and to become aware of the methods how to improve the situation.
- Office workers display moderate and good work ability.
- The best work ability is shown in the age group between 20 and 49; work ability decreases with age.
- After ME® training, work ability improved in the age group up to 29 years, in the group with the working time up to nine years, as well as regardless of the family status and education.
- Employees’ stress-causing factors include bad relationship with their workmates; competitive and strenuous atmosphere at workplace; psychological violence or bullying at workplace; a workplace not always being supportive and open to new ideas; suspending carrying out ongoing task because of an urgent matter; insufficient amount of discussion at a workplace concerning the aims and tasks related to one’s work; possibility to accidentally ruin some valuable equipment or work result. Approximately half of respondents consider their work being psychologically strenuous, and employees experience stress at their workplace; the majority of employees cannot relax after work.
- After ME® training, some of stress-causing factors improved: possibility to influence the situation at workplace; work became more autonomous, more attention is paid to relationships with workmates at a workplace, there is less hurry to finish one’s task, or suspend carrying out an ongoing task; decreased the number of employees who consider their job being psychologically strenuous, although the workplace atmosphere became slightly competitive, the workplace still was not supportive of new ideas and employees cannot relax after a working day.
- There was found a weak correlation between work ability and stress-causing factors which characterise the situation in work, perceived environment, job satisfaction and health status. No correlation between work ability and relationships with immediate superior was detected.
Acknowledgements
This research was supported by the Central Baltic INTERREG IV A Programme 2007–2013 project “Work Ability and Social Inclusion” (WASI).
References
- Tennant C. Work-related stress and depressive disorders // Journal Psychosom Res, 2001; 51: 697–704.
- Gould R., Ilmarinen J., Järvisalo J., Koskinen S. Dimensions of work ability. Results of the health survey 2000 – Helsinki, 2008; – P. 185.
- Jmker S. I., Huysmans M. A., Blatter B. M., et al. Should office workers spend fewer hours at their computer? A systematic review of the literature // Occupational and Environmental Medicine, 2007; 64: 211–222.
- Ilmarinen J., Rantanen J. Promotion of work ability during ageing // American Journal of Industrial Medicine, 1999; (Suppl): 21–23.
- Ilmarinen J. Ageing workers in Finland and in the European Union: Their situation and the promotion of their working ability, employability and employment // Geneva Papers on Risk and Insurance-Issues and Practice, 2001; 26: 623–641.
- Transforming disability into ability: Policies to promote work and income security for disabled people. – OECD, 2003. – P. 219.
- Ilmarinen J., Tuomi K. Past, present and future of work ability // Ilmarinen J., Lehtinen S. (ed.). Past, present and future of work ability. People and work research reports 65. – Helsinki: Finnish Institute of Occupational Health, 2004. – Pp. 1–25.
- Tuomi K., Ilmarinen J., Seitsamo J., et al. Summary of the Finnish research project (1981–1992) to promote the health and work ability of aging workers // Scandinavian Journal of Work and Environmental Health, 1997; 23 (Suppl 1): 66–71.
- Tuomi K., Ilmarinen J., Martikainen R., et al. Aging, work, life-style and work ability among Finnish municipal workers in 1981–1992 // Scandinavian Journal of Work and Environmental Health, 1997; 23 (Suppl 1): 58–65.
- Tuomi K., Huuhtanen P., Nykyri E., et al. Promotion of work ability, the quality of work and retirement // Occupational Medicine-Oxford, 2001; 51: 318–324.
- Ilmarinen J. The Work Ability Index (WAI) // Occupational Medicine, 2007; 58: 160.
- Tuomi K., Ilmarinen J., Jahkola A., et al. Work ability index. – 2nd ed. – Helsinki: Finnish Institute of Occupational Health, 1998. – P. 1.
- Ilmarinen J. Towards a longer worklife. – Helsinki: FIOH Bookstore, 2005. – P. 467.
- Van den Berg T., Elders L., de Zwart B., Burdorf A. The effects of work-related and individual factors on the Work Ability Index: A systematic review // Occupational and Environmental Medicine, 2009; 66; 211–220.
- Min-Chi C. B. S., Mao-Jiun J. W., Chih-Wei L., et al. Evaluating work ability and quality of life for clinical nurses in Taiwan // Nursing Outlook, 2007; 55 (6): 318–326.
- Bobko N. A. Work ability, age and its perception, and other related concerns of Ukraine health care workers // Exp Aging Res, 2002; 28: 59–71.
- Monteiro M. S., Ilmarinen J., Corraa F. H. R. Work ability of workers in different age groups in a public health institution in Brazil // Int Journal of Occupational Safety and Ergonomics, 2006; 12: 417–427.
- Pranjic N., Males-Bilic L., Beganlic A., et al. Mobbing, stress, and work ability index among physicians in Bosnia and Herzegovina: Survey study // Croatian Medical Journal, 2006; 47: 750–758.
- Milani D., Monteiro M. S. Musculoskeletal symptoms and work ability among agricultural machinery operators // Work: A Journal of Prevention, Assessment and Rehabilitation, 2012; 41: 5721–5724.
- Laurier J. Work ability in Netherlands. Blik op Werk Foundation The Netherlands, http://www.heldrich.rutgers.edu/sites/default/files/content/Workability_in_the_Netherlands.pdf
- Radkiewich P., Widerszal-Bazyl M. Psychometric properties of Work Ability Index in the light of comparative survey study. International congress series 1280. – The Netherlands: Elsevier, 2005. – Pp. 304–309.
- Mazloumi A., Rostamabadi A., Nasl Saraji G., Rahimi Foroushani A. Work ability index (WAI) and its association with psychosocial factors in one of the petrochemical industries in Iran // Journal of Occupational Health, 2012; 54 (2): 112–118.
- Karttunen J. P., Rautiainen R. H. Work Ability Index among Finnish dairy farmers // Journal of Agricultural Safety and Health, 2009; 15 (4): 353–364.
- Alexopoulos E. C., Merekoulias G., Gnardellis Ch., Jelastopulu E. Work Ability Index: Validation of the Greek version and descriptive data in heavy industry employees // British Journal of Medicine & Medical Research, 2013; 3 (3): 608–621.
- Morschhäuser M., Sochert R. Healthy work in an ageing Europe // Strategies and Instruments for Prolonging Working Life, 2006; 76.
- Sjögren-Rönkä T., Ojanen M. T., Leskinen E. K., et al. Physical and psychosocial prerequisites of functioning in relation to work ability and general subjective well-being among office workers // Scand J Work Environment & Health, 2002; 28: 184–190.
- Martinez M. C., Latorre M. Health and work ability among office workers // Rev Saúde Pública, São Paulo, 2006; 40 (5): 1–7.
- Jędryka-Góral A., Łastowiecka J. B., Najmiec A. Work ability in ageing workers suffering from chronic diseases // International Journal of Occupational Safety and Ergonomics (JOSE), 2006; 12 (1): 17–30.
- Habibi E., Dehghan H., Safari S., et al. Effects of work-related stress on work ability index among refinery workers // Journal of Education and Health Promotion, 2014; 3: 18.
- Wolf K., Karch R. C. Global Perspectives in Workplace // American Journal of Health Promotion, 2012; 179: 176–178.
- Elo A. L., Leppanen A., Lindstrom K., Ropponen T. Occupational stress questionnaire: User’s instructions. – Helsinki: Finnish Institute of Occupation Health, 1992. – P. 47.
- Lindstom K., Elo A. L., Skogstad A., et al. User’s guide for the QPSnordic general nordic questionnaire for psychological and social factors at work // TemaNord, 2000; 603: 74.
- Ilmarinen J. Aging and work // Occupational and Environmental Medicine, 2001; 58: 546–552.
- Golubic R., Milosevic M., Knezevic B., Mustajbegovic J. Work-related stress, education and work ability among hospital nurses // Journal of Advanced Nursing, 2009; 65 (10): 2056–2066.
- Brešić J., Knežević B., Milošević M., et al. Stress and work ability in oil industry workers // Archives of Industrial Hygiene and Toxicology, 2007; 58 (4): 399–405.
- Liu J., Wang Z.,Wang M., Lan Y. Factors of occupational stress on the working ability of petroleum workers // WeiSheng Yan Jiu, 2001; 30: 263–265.