Assessment of Osseous Structure Disorders of TMJ in Class II and Class III Patients with Different Mandibular Rotation using CBCT
Abstract
Temporomandibular joint (TMJ) osseous structures disorders (OSD) were evaluated in cone beam computer tomography images of 117 consecutive patients with Class II and Class III dentofacial deformities according to research diagnostic criteria related to the maxillary-mandibular plane (MM) angle. The distribution of the number and percentage of affected joints with the OSD signs in Class II was markedly different in groups divided according to the MM angle. Statistically significant increase was found in the percentage of joints affected with the OSD separately for each side, i.e., right (p = 0.001), left (p = 0.04) and both together (p = 0.0001), in Class II patient group, and an increased MM angle indicated backward rotation of the mandible. In Class III patients, there were no statistically significant differences in the number of joints affected by the OSD. The presence of the changes was asymmetrical between the left and right joints in both Class II and Class III patient groups.
In conclusion, the OSD signs are more common in patients with Class II skeletal dentofacial deformities with backward rotation of the mandible.
Introduction
An important factor that should be considered when planning treatment for dentofacial deformities is existing relapses caused by destruction of the osseous tissue of the TMJ. Destruction of the osseous tissue into the joint is frequently associated with inflammatory or degenerative changes that can result in mandibular morphological and functional changes (Dworkin, 1992).
Although the TMJ is anatomically characterised as load-receiving, its structure can change through excessive or unbalanced functional loading to produce TMJ dysfunctional remodelling, which in the majority of cases passes asymptomatically and affects the function of the joint and occlusal stability, i.e., the volume of the osseous tissue changes, and the length of the mandibular condylar head and mandibular ramus decreases. Reduced mandibular growth in children and adolescents in addition to progressive mandibular backward rotation in adults can develop in such cases (Arnett, 1996).
Various controversial beliefs exist regarding changes of the TMJ osseous structure depending on the type deformation and its manifestation determined using two-dimensional (2D) radiological investigation methods (Kurita, 2000; Honda, 2001; Katsavrias, 2005, 2006; Hussain, 2008; Vitral, 2004, 2011).
In maxillofacial radiology, cone beam computed tomography (CBCT) provides a three-dimensional (3D) image and provides a more qualitative evaluation of the TMJ osseous tissue structure than conventional CT; it also offers the advantages of low radiation and the ability to be used in orthodontic practice (Lubele, 2009; Davies, 2012).
Evaluation of morphological features and quality of TMJ articulating surfaces in 3D CBCT reconstruction images allows precise judgements regarding osseous structure. Evaluation of these osseous changes using 3D CBCT is thus helpful for investigating in greater depth the morphology of the TMJ and for recognising the risk of occlusal stability.
Aim
The aim of the current study was to determine the relationship between the vertical rotation of the mandible and of the OSD of the TMJ in patients with dentofacial deformities Class II and Class III using CBCT images.
Material and Methods
The study included 117 orthognathic surgery patients with dentofacial deformities and without complaints related to the TMJ: 56 skeletal Angle Class II patients (42 patients in Class II/1 and 14 patients in Class II/2) and 61 skeletal Angle Class III patients before orthodontic treatment. The mean age of the patients was 20.58 ± 4.27 years, and the study groups included 55 or 47 % males and 62 or 53 % females, respectively. The exclusion criteria for the study were as follows: congenital dentofacial syndromes (including labial and/or palatal cleft), clinically visible skeletal facial asymmetry, rheumatoid or other types of arthritis, trauma in the maxillofacial area in the patient history, complaints regarding temporomandibular disorders, pain in the maxillofacial area, pronounced noise in the temporomandibular joint and previous orthodontic treatment with functional devices and/or fixed appliance.
Class II, Class III of the dentofacial deformity was determined from data obtained from cephalometric analyses of CBCT images in the sagittal plane based on SNA and SNB angles, ANB angle and Wits appraisal values.
Vertical relationship of jaws were analysed based on the cephalometric horizontal planes of the face, i.e., the cranial base, Frankfurt, palatal and mandibular planes. To classify the study groups, were used the maxillary and mandibular plane angle (MM angle) to determine the rotation of mandible. Based on the values of the MM angle, the patients of Class II and Class III were divided into study groups (Table 1). A neutral vertical relationship of the jaws was characterised by the MM angle of 22–32° or mean angle of 27 ± 5°; an angle smaller than 22° indicated forward rotation, whereas an angle larger than 32° indicated backward rotation of the mandible.
In all of the included patients, diagnosis and treatment planning were performed using cone beam computed tomography (CBCT) equipment CBCT (iCAT New Generation, Imaging Sciences International, Inc. Hatfield, PA, USA) before the orthodontic treatment was started.
During the examination, each patient was in a sitting position, with the head in a natural position to ensure maximum intercuspidation. A standardised protocol was used for the equipment (voltage, 120 KV; current, 38 mA; field of view (FOV), 17 cm; resolution, 0.4 voxels; approximate dose of radiation, 36 μSv).
Table 1. Distribution of patients by MM angle in study groups
| MM Angle | Class II | Class III | ||
|---|---|---|---|---|
| N | % | N | % | |
| 22–32° | 18 | 32 | 34 | 56 |
| ≥ 32° | 22 | 39 | 15 | 24 |
| ≤ 22° | 16 | 29 | 12 | 20 |
| Total | 56 | 100 | 61 | 100 |
For the cephalometric analyses of CBCT data, the Dolphin programme, version 11.0 was used (Dolphin imaging, CA, USA). Analysis of all of the CBCT images was performed by the authors.
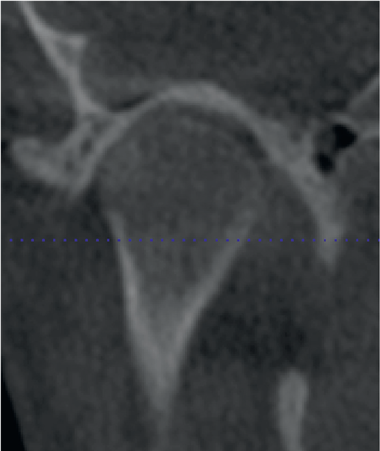
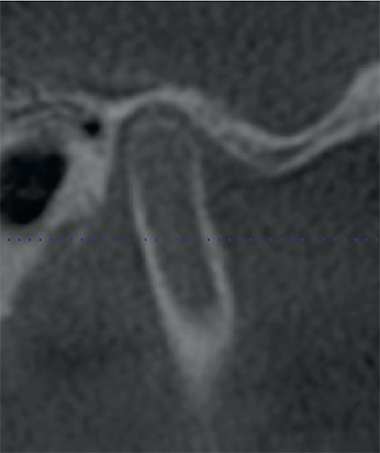
The acquired examination data were processed and analysed by applying the software supplied with the iCAT Vision equipment. The presence of OSD was assessed in the coronary and sagittal planes (Fig. 1, Fig. 2) according to the research diagnostic criteria for temporomandibular disorders (RDC/TMD) of the osseous structures Axis I established by Dworkin (1992) and Ahmad (2009). This analysis included a description of the disorder signs of the structural quality and quantity of the articular condyle and articular fossa/eminence complex in the TMJ with regard to condylar hypoplasia, condylar hyperplasia, articular surface flattening, subcortical sclerosis, subcortical cysts, surface erosion, osteophytes, generalised sclerosis, loose joint body, deviation in form and ankylosis. The RDC/TMD scoring was used to determine the severity of the OSD in TMJ: no osteoarthritis, indeterminate osteoarthritis (IOA) and osteoarthritis (OA). In further detail, no osteoarthritis included normal relative size of the condylar head, no subcortical sclerosis or articular surface flattening and no deformation caused by subcortical cysts, surface erosion, osteophytes or generalised sclerosis. IOA included normal relative size of the condylar head or articular surface flattening with/without subcortical sclerosis and no deformation caused subcortical cysts, surface erosion, osteophytes, or generalised sclerosis. OA included deformation caused by subcortical cysts, surface erosion, osteophytes or generalised sclerosis. The prevalence was calculated separately for each joint; therefore, both TMJs of the same patient received different diagnoses.
The aim of the statistical data analysis was to evaluate the distribution of the OSD in TMJ (in condyle and fossa) between study groups. Data on the presence of descriptive signs were entered into the database, which later was converted into the database format of the statistical software SPSS (Inc., USA). All calculations were performed using this software. After at least a two-week interval, 71 selectively chosen patients (i.e., 50 % of all included patients) were re-evaluated. Dahlberg`s approach was used for the calculation of measurement error (Dahlberg, 1940), and an error less than 1 was regarded as tolerable. Mean values and standard deviations were calculated. Distribution frequencies / prevalence were assessed. Pearson’s Chi-squared test and Fisher’s exact test were used to evaluate the statistical significance of differences in prevalence among the groups.
Figure 1. Image of the condyle in coronary plane | Figure 2. Image of the condyle in sagittal plane |
|
|
The difference of means between groups was assessed using t-tests for paired data and for non-paired data. For comparison of means among more than two groups, an analysis of variance (one-way ANOVA) with Bonferroni correction was used. The level of statistical significance of p ≤ 0.05 was used in all cases.
The study was approved by the permission of the Ethics Committee of Rīga Stradiņš University (Decision accepted on April 19, 2007), with the principles laid down in the Declaration of Helsinki.
Results
Analysis of prevalence of OSD signs in TMJ revealed a statistically significant difference (p = 0.014) between Class II and Class III patients. One or several signs were determined in 38.4 % of Class II group and 28.7 % of Class III group.
Class II/1 and Class II/2 patients presented no statistically significant differences in the prevalence of joints affected by OSD signs between Class II subdivisions (Tables 2 and 3). The number of joints, in which no signs of OSD were found and those in which at least one sign was found, was almost equal; therefore, these patients were analysed within the same group.
Table 2. Presence of OSD signs in Class II subdivisions on the left side
| Presence of signs | Subdivision 1 | Subdivision 2 | Total | ||
|---|---|---|---|---|---|
| Number of joints | % | Number of joints | % | ||
| No | 22 | 52.4 | 7 | 50 | 29 |
| Yes | 20 | 47.6 | 7 | 50 | 27 |
| Total | 42 | 100 | 14 | 100 | 56 |
Results non-significant (p = 0.88)
Table 3. Presence of OSD signs in Class II subdivisions on the right side
| Presence of signs | Subdivision 1 | Subdivision 2 | Total | ||
|---|---|---|---|---|---|
| Number of joints | % | Number of joints | % | ||
| No | 24 | 57.14 | 11 | 78.57 | 35 |
| Yes | 18 | 42.86 | 3 | 24.43 | 21 |
| Total | 42 | 100 | 14 | 100 | 56 |
Results non-significant (p = 0.16)
The number of affected joints with OSD in Class II was markedly different in groups that were classified based on the MM angle into backward and forward rotation; increased MM angle indicated backward rotation of the mandible. Statistically significant differences were found in the number of affected joints separately for each side: 54.5 % (p = 0.001) on the right and 59.1 % (p = 0.04) on the left (Tables 4 and 5) sides, and 56.8 % (p = 0.0001) in both (Table 6) patient groups.
In Class III patients, there was no statistically significant difference in the percentage of joints affected with and the type of mandibular rotation related to the MM angle (Tables 7–9). The presence of OSD was asymmetrical between the left and right joints in both Class II and Class III patient groups.
A detailed analysis of the prevalence of each sign of OSD in the condyle and fossa eminence in Class II patient group indicated that condylar hypoplasia, flattening, sub-sclerosis, osteophytes, deviation in form and the fossa flattening were present. Subcortical cyst, generalised sclerosis, loose joint body and ankylosis were not found. A higher percentage of signs was observed in the right and left sides of Class II patients with mandibular backward rotation than in the groups with neutral position or forward rotation.
Table 4. Number of joints with OSD signs related to the MM angle of the right side in Class II
| MM Angle | No signs | Presence of signs | Total | |||
|---|---|---|---|---|---|---|
| Number of joints | % | Number of joints | % | Number of joints | % | |
| 22–32° | 9 | 50.0 | 9 | 50.0 | 18 | 100 |
| ≥ 32° | 10 | 45.5 | 12 | 54.5 | 22 | 100 |
| ≤ 22° | 16 | 100 | 0 | 0 | 16 | 100 |
Results with statistical significance (p = 0.001)
Table 5. Number of joints with OSD signs related to the MM angle of the left side in Class II
| MM Angle | No signs | Presence of signs | Total | |||
|---|---|---|---|---|---|---|
| Number of joints | % | Number of joints | % | Number of joints | % | |
| 22–32° | 10 | 55.6 | 8 | 44.6 | 18 | 100 |
| ≥ 32° | 9 | 40.9 | 13 | 59.1 | 22 | 100 |
| ≤ 22° | 15 | 93.8 | 1 | 6.3 | 16 | 100 |
Results with statistical significance (p = 0.04)
Table 6. Number of joints with OSD signs related to the MM angle on both sides in Class II
| MM Angle | No signs | Presence of signs | Total | |||
|---|---|---|---|---|---|---|
| Number of joints | % | Number of joints | % | Number of joints | % | |
| 22–32° | 19 | 52.8 | 17 | 47.2 | 36 | 100 |
| ≥ 32° | 19 | 43.2 | 25 | 56.8 | 44 | 100 |
| ≤ 22° | 31 | 96.9 | 1 | 3.1 | 32 | 100 |
Results with statistical significance (p = 0.0001)
Table 7. Number of joints with OSD signs related to the MM angle of the right side (in Class III)
| MM Angle | No signs | Presence of signs | Total | |||
|---|---|---|---|---|---|---|
| Number of joints | % | Number of joints | % | Number of joints | % | |
| 22–32° | 27 | 79.4 | 7 | 20.6 | 34 | 100 |
| ≥ 32° | 12 | 80.0 | 3 | 20.0 | 15 | 100 |
| ≤ 22° | 10 | 83.3 | 2 | 16.7 | 12 | 100 |
Results non-significant (p = 0.95)
Table 8. Number of joints with OSD signs related to MM angle on the left side in Class III
| MM Angle | No signs | Presence of signs | Total | |||
|---|---|---|---|---|---|---|
| Number of joints | % | Number of joints | % | Number of joints | % | |
| 22–32° | 23 | 67.6 | 11 | 32.4 | 34 | 100 |
| ≥ 32° | 9 | 60.0 | 6 | 40.0 | 15 | 100 |
| ≤ 22° | 6 | 50.0 | 6 | 50.0 | 12 | 100 |
Results non-significant (p = 0.54)
Table 9. Number of joints with OSD signs related to MM angle of both sides (in Class III)
| MM Angle | No signs | Presence of signs | Total | |||
|---|---|---|---|---|---|---|
| Number of joints | % | Number of joints | % | Number of joints | % | |
| 22–32° | 50 | 73.5 | 18 | 26.5 | 68 | 100 |
| ≥ 32° | 21 | 70.0 | 9 | 30.0 | 30 | 100 |
| ≤ 22° | 16 | 66.7 | 8 | 33.3 | 24 | 100 |
Results non-significant (p = 0.8)
The most common sign of OSD in patients of Class III group was flattening of the condyle. There was no difference in the prevalence of signs related to mandibular rotation. The percentage of joints affected by disorders was not significantly different among MM angle groups in Class II and Class III patient groups. The prevalence of OSD signs between the right and left sides was asymmetrical (Tables 10–13).
Table 10. OSD signs related to MM angle of the right side (in Class II)
| Signs of TMD | MM Angle | Total | ||||||
|---|---|---|---|---|---|---|---|---|
| 22–32° | ≥ 32° | ≤ 22° | ||||||
| N | % | N | % | N | % | N | % | |
| Condylar hypoplasia | 4 | 22.2 | 3 | 13.6 | 0 | 0 | 7 | 12.5 |
| Flattening | 4 | 22.2 | 6 | 27.3 | 0 | 0 | 10 | 17.9 |
| Sub-sclerosis | 1 | 5.6 | 1 | 4.5 | 0 | 0 | 2 | 3.6 |
| Erosion | 0 | 0 | 2 | 9.1 | 0 | 0 | 2 | 3.6 |
| Osteophyte | 0 | 3 | 13.6 | 0 | 0 | 3 | 5.4 | |
| Deviation | 2 | 11.1 | 2 | 9.1 | 0 | 0 | 4 | 7.1 |
| Ankylosis | 0 | 0 | 0 | 0 | 0 | 0 | 0 | 0 |
| Fossa flattening | 0 | 0 | 2 | 9.1 | 0 | 0 | 2 | 3.6 |
| Total | 18 | 100 | 22 | 100 | 16 | 100 | 56 | 100 |
Results non-significant (p = 0.44)
Table 11. OSD signs related to the MM angle of the left side in Class II
| Signs of TMD | MM Angle | Total | ||||||
|---|---|---|---|---|---|---|---|---|
| 22–32° | ≥ 32° | ≤ 22° | ||||||
| N | % | N | % | N | % | N | % | |
| Condylar hypoplasia | 3 | 16.7 | 3 | 13.6 | 0 | 0 | 6 | 10.7 |
| Flattening | 4 | 22.2 | 9 | 40.9 | 0 | 0 | 13 | 23.2 |
| Sub-sclerosis | 2 | 11.1 | 2 | 9.1 | 1 | 6.3 | 5 | 8.9 |
| Erosion | 0 | 0 | 2 | 9.1 | 0 | 0 | 2 | 3.6 |
| Osteophyte | 2 | 11.1 | 5 | 22.7 | 0 | 0 | 7 | 12.5 |
| Deviation | 2 | 11.1 | 1 | 4.5 | 0 | 0 | 3 | 5.4 |
| Ankylosis | 0 | 0 | 0 | 0 | 0 | 0 | 0 | 0 |
| Fossa flattening | 1 | 5.6 | 3 | 13.6 | 0 | 0 | 4 | 7.1 |
| Total | 18 | 100 | 22 | 100 | 16 | 100 | 56 | 100 |
Results non-significant (p = 0.53)
Table 12. OSD signs related to MM angle of the right side in Class III
| Signs of TMD | MM Angle | Total | ||||||
|---|---|---|---|---|---|---|---|---|
| 22–32° | ≥ 32° | ≤ 22° | ||||||
| N | % | N | % | N | % | N | % | |
| Condylar hypoplasia | 0 | 0 | 1 | 6.7 | 0 | 0 | 1 | 1.6 |
| Flattening | 4 | 11.8 | 2 | 13.3 | 2 | 16.7 | 8 | 13.1 |
| Osteophyte | 1 | 2.9 | 0 | 0 | 0 | 0 | 1 | 1.6 |
| Deviation | 2 | 5.9 | 0 | 0 | 0 | 0 | 2 | 3.3 |
| Fossa flattening | 1 | 2.9 | 0 | 0 | 0 | 0 | 1 | 1.6 |
| Total | 34 | 100 | 15 | 100 | 12 | 100 | 61 | 100 |
Results non-significant (p = 0.59)
Table 13. OSD signs related to MM angle of the left side in Class III
| Signs of TMD | MM Angle | Total | ||||||
|---|---|---|---|---|---|---|---|---|
| 22–32° | ≥ 32° | ≤ 22° | ||||||
| N | % | N | % | N | % | N | % | |
| Condylar hypoplasia | 0 | 0 | 0 | 0 | 1 | 8.3 | 1 | 1.6 |
| Flattening | 9 | 26.5 | 4 | 26.7 | 3 | 25.0 | 16 | 26.2 |
| Sub-sclerosis | 1 | 2.9 | 0 | 0 | 1 | 8.3 | 2 | 3.3 |
| Osteophyte | 2 | 5.9 | 1 | 6.7 | 0 | 0 | 3 | 4.9 |
| Deviation | 0 | 0 | 1 | 6.7 | 1 | 8.3 | 2 | 3.3 |
| Fossa flattening | 0 | 0 | 1 | 6.7 | 0 | 0 | 1 | 1.6 |
| Total | 34 | 100 | 15 | 100 | 12 | 100 | 61 | 100 |
Results non-significant (p = 0.43)
Osteoarthritis was diagnosed according to quantification of the RDC/TMD of osseous components in relation to the MM angle in joints on both sides in Class II patients, and statistically significant indeterminate osteoarthritis and osteoarthritis in the TMJ was observed in 18.2 % and 11.4 %, respectively, of the backward rotation group. In the mandible neutral position group, the prevalence of osteoarthritis in both sides and only on one side was 38.9 % and 8.3 %, respectively (Table 14). The distribution of the diagnoses of indeterminate osteoarthritis and osteoarthritis was not significantly related to the MM angle in Class III patients (Table 15).
Table 14. Distribution of the diagnosis of TMJ osteoarthritis with respect to the MM angle in both sides in Class II
| Diagnosis | 22–32° | ≥ 32° | ≤ 22° | |||
|---|---|---|---|---|---|---|
| Number of joints | % | Number of joints | % | Number of joints | % | |
| No osteoarthritis | 19 | 52.8 | 19 | 43.2 | 31 | 96.9 |
| Indeterminate osteoarthritis on both sides | 0 | 0 | 8 | 18.2 | 0 | 0 |
| Indeterminate osteoarthritis on only one side | 0 | 0 | 5 | 11.4 | 1 | 3.1 |
| Osteoarthritis on both sides | 14 | 38.9 | 0 | 0 | 0 | 0 |
| Osteoarthritis on only one side | 3 | 8.3 | 2 | 4.5 | 0 | 0 |
| Total | 36 | 100 | 44 * | 100 | 32 | 100 |
Results with statistical significance (p = 0.001)
* Five patients had indeterminate osteoarthritis in one joint and osteoarthritis in other joint simultaneously (number of joints = 10).
Table 15. Distribution of diagnosis TMJ osteoarthritis related to the MM angle MM in Class III
| Signs of TMD | 22–32° | ≥ 32° | ≤ 22° | |||
|---|---|---|---|---|---|---|
| Number of joints | % | Number of joints | % | Number of joints | % | |
| No osteoarthritis | 50 | 73.5 | 21 | 70.0 | 16 | 66.7 |
| Indeterminate osteoarthritis on both sides | 8 | 11.8 | 4 | 13.3 | 2 | 25.0 |
| Indeterminate osteoarthritis on only one side | 8 | 11.8 | 5 | 16.7 | 6 | 8.3 |
| Osteoarthritis on only one side | 2 | 2.9 | 0 | 0 | 0 | 0 |
| Total | 18 | 100 | 30 | 100 | 24 | 100 |
Results non-significant (p = 0.67)
Discussion
This study of CBCT images evaluated mandibular condyle and articular/fossa structure disorders in RDC/TMD axis I related to mandibular rotation in patients with skeletal Class II and Class III dentofacial deformities and found a statistically significant relationship between the radiographic features of the disorders and mandibular backward rotation in Class II patients but not Class III patients.
Our results suggest different prevalence of osseous disorders signs in different study groups; more frequent in Class II patients than in Class III patients, which indicates the role of skeletal discrepancy of the jaws in the development of TMJ osseous destruction. The study groups were classified according to jaw skeletal discrepancy as determined by the MM rotation angle, which represents the vertical jaw rotation. The number of joints affected with OSD signs were identified in the groups classified according to the MM angle. The number of affected joints was highest in Class II patients with an increased MM angle. The signs were observed asymmetrically between the left and right joints, although these patients had no clinically visible jaw asymmetry. A previous study observed that TMJ changes had wide inter-individual variation even in patients with clinically similar malocclusions (Krisjane, 2012).
The most frequently occurring signs of OSD of TMJ in Class II and Class III study groups with mandibular backward rotation were flattening of articular surface of the condyle and fossa eminence. In literature, flattening of the articular surface of the TMJ was described to result from remodelling (Kurita, 2000), which can be radiologically defined as minor changes in the shape of the bone (Honda, 2001). Such flattening may present in both symptomatic and asymptomatic joints as a sign of indeterminate osteoarthritis (Ahmad, 2009), and it can be considered as a functional adaptation (Brooks, 1992). The other most common signs of OSD in TMJ for Class II and Class III patients with mandibular backward rotation were erosion and osteophytes of the condyle. The presence of erosion in joint surfaces characterises the initial stage of degenerative changes in osteoarthritis and indicates the likely instability of the TMJ osseous structure (Ahmad, 2009) accompanied by the risk of altered the area of the joint surfaces, which can cause occlusal changes (Hussain, 2008). The presence of osteophytes in the joint together with other signs is an important criterion for radiological diagnosis of osteoarthritis; in contrast to erosions, osteophytes occur in the late stage of degenerative changes during adaptation (van der Kraan, 2007).
All of Dworkin’s (Dworkin, 1992) criteria for assessment of changes in the TMJ can be categorised in the following groups: 1) the result of chronic adaption or active on-going changes; 2) changes that have an impact on function of the joint and quality of life, or asymptomatic; 3) changes that are reversible or irreversible. Only part of the mentioned diagnostic system was used in the study, and results describe the prevalence of signs in osseous structures. Based on the RCD/TMD criteria used in the study, the temporomandibular joints were radiologically assessed as a whole with regard to structural changes of osseous tissue quality. The signs and prevalence of disorders were evaluated according to the scoring for indeterminate osteoarthritis and osteoarthritis.
The manifestations of condylar destruction allow further considerations regarding the course of degenerative joint destruction and function of the joint, and occlusion is characterised by progressive mandibular backward rotation in adults (Arnett, 1996; Alexiou, 2009; Cevidanes, 2010) and is the reason for mandibular growth deviations in childhood and adolescence (Pirttiniemi, 2009). The studied literature indicates that bone loss at the mandibular condyle may result from the dysfunctional remodelling by orthognathic surgery, systemic and local arthritis, post-traumatic remodelling and hormonal imbalance (Arnett, 1992; Gunson, 2012).
An opinion exists that considerations regarding on-going processes in the TMJ can be based on established changes before orthodontic and orthognathic surgical treatment.
A cephalometric study of mandibular advancement surgery in Class II patients demonstrated that high-angle patients were associated with both a higher frequency and a greater magnitude of horizontal relapse (Mobarak, 2001).
Conclusion
The most common OSD of the TMJ related to skeletal Class II patients is mandibular backward rotation.
Long-term observation allows the understanding of whether mandibular rotation is the cause or consequence of TMJ destruction in orthodontic and orthognathic surgery, and aids in determining instability in patients with dentofacial deformities.
References
- Ahmad M., Hollender L., Anderson Q., Kartha K., Ohrbach R., Truelove E. L., John M. T., Schiffman E. L. Research diagnostic criteria for temporomandibular disorders (RDC/TMD): development of image analysis criteria and examiner reliability for image analysis. Oral Surgery Oral Medicine Oral Pathology Oral Radiolology Endodontics, 2009; 107 (6): 844–859.
- Alexiou K. E., Stamatakis H. C., Tsiklakis K. Evaluation of the severity of temporomandibular joint osteoarthritic changes related to age using cone beam computed tomography. Dentomaxillofacial Radiolology, 2009; 38 (3): 141–147.
- Arnett G. W., Milam S. B., Gottesman L. Progressive mandibular retrusion idiopathic condylar resorption. Part I. American Journal of Orthodontics and Dentofacial Orthopedics, 1996; 101 (1): 8–15.
- Brooks S. L., Westesson P. L., Eriksson L., Hansson L. G., Barsotti J. R., Arbor A. Prevalence of osseous changes in the temporomandibular joint of asymptomatic persons without internal derangement. Oral Surgery Oral Medicine Oral Pathology, 1992; 73 (1): 122–226.
- Cevidanes L. H. S., Hajati A. K., Paniagua B., Lim P. F., Walker D. G., Palconet G., Nackley A. G., Styner M., Ludlow J. B., Zhu H., Phillips C. Quantification of condylar resorption in temporomandibular joint osteoarthritis. Oral Surgery Oral Medicine Oral Patholology Oral Radiology Endodontics, 2010; 110 (1): 110–117.
- Dahlberg G. Statistical Methods for Medical and Biological Students. London: George Allen and Unwin, 1940.
- Davies J., Johnson B., Drage N. A. Effective dose from cone beam CT investigation of the jaws. Dentomaxillofacial Radiology, 2012; 41 (1): 30–36.
- Dworkin S. F., LeResche L. Research diagnostic criteria for temporomandibular disorders: review, criteria, examinations and specifications, critique. Journal of Craniomandibular Disorders, 1992; 6 (4): 301–355.
- Gunson M. J., Arnett W., Milam S. B. Pathophysiology and pharmacologic control of osseous mandibular condylar resorption. Journal of Oral and Maxillofacial Surgery, 2012; 70: 1918–1934.
- Honda K., Larheim T. A., Sano T., Hashimoto K., Shinoda K., Westensson P. L. Thickening of the glenoid fossa in osteoarthritis of the temporomandibular joint. An autopsy study. Dentomaxillofacial Radiology, 2001; 30 (1): 10–13.
- Hussain A. M., Packota G., Major P. W., Flores-Mir C. Role of different imaging modalities in assessment of temporomandibular joint erosions and osteophytes: a systematic review. Dentomaxillofacial Radiology, 2008; 37 (2): 63–71.
- Katsavrias E. G. Morphology of the temporomandibular joint in subjects with Class II division 2 malocclusions. American Journal of Orthodontics and Dentofacial Orthopedics, 2006; 129 (4): 470–478.
- Katsavrias E. G., Halazonetis D. J. Condyle and fossa shape in Class II and Class III skeletal patterns: a morphometric tomography study. American Journal of Orthodontics and Dentofacial Orthopedics, 2005; 128 (3): 337–346.
- Krisjane Z., Urtane I., Krumina G., Neimane L., Rogovska I. The prevalence of TMJ osteorathritis in asymptomatic patients with dentofacial deformities: a cone-beam CT study. International Journal of Oral and Maxillofacial Surgery, 2012; 41: 690–695. 10.1016/j.ijom.2012.03.006.
- Kurita H., Ohtsuka A., Kobayashi H., Kurashina K. Flattening of the articular eminence correlates with progressive internal derangement of the temporomandibular joint. Dentomaxillofacial Radiology, 2000; 29 (5): 277–279.
- Loubele M., Bogaerts R., van Dijck E., Pauwels R., Vanheusden S., Suetens P., Marchal G., Sanderink G., Jacobs R. Comparison between effective radiation dose of CBCT and MSCT scanners for dentomaxillofacial applications. European Journal of Radiology, 2009; 71 (3): 461–468.
- Mobarak K. A., Espeland L., Krogstad O., Lyberg T. Mandibular advancement surgery in high-angle and low-angle Class II patients: Different long-term skeletal responses. American Journal of Orthodontics and Dentofacial Orthopedics, 2001; 119: 368–381.
- Petterson A. Imaging of the temporomandibular joint. In: Manfredini D. Current Concepts on Temporomandibular Disorders. London: Quintessence Publishing, 2010.
- Pirttiniemi P., Peltomaki T., Muller L., Luder H. U. Abnormal mandibular growth and the condylar cartilage. European Journal of Orthodontics, 2009; 31: 1–11.
- van der Kraan P. M., van den Berg W. B. Osteophytes: relevance and biology. Osteoarthritis and Cartilage, 2007; 15 (3): 237–244.
- Vitral R. W. F., da Silva Campos M. J., Rodrigues A. F., Fraga M. R. Temporomandibular joint and normal occlusion: is there anything singular about it? A computed tomography evaluation. American Journal of Orthodontics and Dentofacial Orthopedics, 2011; 140 (1): 18–24.
- Vitral R. W. F., Telles C. S., Fraga M. R., Fortes de Oliveira R. S. M., Tanaka O. M. Computed tomography evaluation of temporomandibular joint alterations in patients with Class II division 1 subdivision malocclusions: condyle-fossa relationship. American Journal of Orthodontics and Dentofacial Orthopedics, 2004; 126 (1): 48–52.