Research Support
Information for researchers that is useful at various stages of a research project – from the initial idea to the dissemination of research findings.
Find out more about RSU Library Digital Exhibition
The most important publications published on the RSU Research Portal in May 2026
The most important publications published on the RSU Research Portal in June 2026
Find information and data
- Resources
What to do if there are problems accessing subscribed e-resources!
Rīga Stradiņš University Library Electronic Catalogue
RSU academic staff publications and Doctoral theses database
RSU defended Bachelor's and Master's theses database
Medical and healthcare analytics database
Digitalized RSU doctoral theses – Instructions for accessing doctoral theses within the Institutional open access e-resource repository (DSpace)
- Search tools and techniques
PRIMO is a search tool, that allows you simultaneously search for information in:
- Union catalogue,
- RSU subscribed online databases,
- Databases created by the Library.
Too many or few results?
Databases and search engines often offer additional ways to search for better results: a good balance between completeness and relevance.
- Thesaurus. Thesaurus (dictionary) is the best place to look for them. PubMed MeSH
- Subject Headings. In various databases, subject headings are assigned to publications. These concisely describe what the publication is about. The subject headings make it possible to search for a topic.
- Fillers. Fillers are words that are common, but not important for a search. Examples of these are determiners and prepositions.
- Combining search terms. Combining multiple topics in one search can be done with Boolean operators.
The main Boolean operators are AND, OR and NOT:
AND --> All specified terms must appear in the search result.
OR --> One, or both, of the specified terms must appear in the search result.
NOT --> The specified term must not appear in the search result.- Nesting terms. With more complex searches, it can be efficient to nest search terms using brackets. Example: pneumonia AND (asthma OR cystic fibrosis)
- Wildcard symbols. Wildcard symbol broadens a search by finding words that start with the same letters. Use it with distinctive word stems to retrieve variations of a term with less typing.
Examples:
psychol * = psychology, psychological, psychologist
environ * = environment, environments, environmental
wom? n = woman, women- Phrase searching. Double quotes around a phrase ("...") indicate that the specified search terms must be side by side in this exact order.
- Proximity operators (NEAR, NEXT, ADJ). In some databases, the distance (the number of words) between two search terms can be chosen, so that variations of compound terms are also found.
- Search fields. Advanced search is designed to search in fields, such as title words, or author name. By using multiple search fields at the same time, the search results are lesser but more relevant.
Additional resources:Search techniques. Karolinska Institutet. University Library.
Science Direct tutorial: Performing an advanced search
Wiley online library - advanced search (Video)
PubMed User Guide
- Finding dataset
Researchers make data available in ways that can vary widely. People are increasingly making datasets that they've created and compiled available for others to use. Finding the data most useful to you can be a bit of a challenge, as there are many different ways that people can choose to release their data, but the following steps will help you efficiently find data that will be useful for you.
3 Steps for an effective dataset search
Step 1 - Identify your dataset needs:
Make your search for data as efficient as possible by figuring out a few things before you get started. Think about and answer the following questions:
- What information must be included in the dataset for it to be useful to me? This could include required fields, information about the spatial or temporal coverage of the data, or a description of any processing or modifications that have been made to the data.
- Which file format(s) am I able to work with? If you are planning on analysing data using specific software, ensure that you know the file formats that can be used with that software.
- Are there any reuse licences that are incompatible with how I will use the data? For instance, if you plan on commercialising your research, then you should avoid datasets that stipulate a non-commercial condition in their reuse licence.
Knowing the answers to these questions will help you perform an effective search by identifying the keywords, filter conditions and data sources that are most appropriate for the data that you want to find.
Step 2 - Search:
There are a number of different strategies you can use to search across the various places that people make data available. The strategies are ordered from the simplest to those that require more effort or may turn up less relevant material.
Search engines and tools:
- Google Datasetsearch. Dataset Search has indexed almost 25 million of these datasets, giving you a single place to search for datasets and find links to where the data is. Use some or all of the identified keywords when searching for data. There are no advanced search interfaces to help narrow your search results. Some of the techniques used to refine regular Google searches will also work for data sets, such as using the AND and OR operators, or a site (to limit your search to a specific site or domain).
- DataMed. DataMed is a prototype biomedical data search engine. Its goal is to discover data sets across data repositories or data aggregators. In the future it will allow searching outside these boundaries. DataMed supports the NIH-endorsed FAIR principles of Findability, Accessibility, Interoperability and Reusability of datasets with current functionality assisting in finding datasets and providing access information about them. DataMed offered list of repositories.
- Zenodo. Zenodo helps researchers receive credit by making the research results citable and through OpenAIRE integrates them into existing reporting lines to funding agencies like the European Commission. Citation information is also passed to DataCite and onto the scholarly aggregators.
- Figshare. An online open access repository where researchers can store and share their research results, including images, datasets, and videos. According to the open data principle, it can be uploaded and accessed free of charge. Figshare supports Digital Science.
- Dry. The aim of ths resources is to create a world, in which research data is openly available, integrated into the scientific literature and regularly used to generate knowledge.
- Re3data. re3data.org offers detailed information on over 2000 different repositories of research data. You can browse by subject or search and filter results to find data archives and repositories that are most relevant to your topic. The results in re3data.org provide a lot of information that can help you determine if a repository will be useful for you.
- OpenAIRE explore. The OpenAIRE Explore portal provides access to Open Access research content. It is based on the OpenAIRE Scientific Communication Open Schedule, which covers all research and scientific activities, covering all stages of the research life cycle.
- RSU data repository Dataverse.
- GenBank is the NIH genetic sequence database, an annotated collection of all publicly available DNA sequences. The GenBank database is designed to provide and encourage access within the scientific community to the most up‐to‐date and comprehensive DNA sequence information
We recommend a couple of options to help find data archives and repositories:
- Use the Registry of Research Data Repositories to find relevant repositories
- Use data repository and/or archive as search terms when using search engines
- Check out the examples of general and discipline-specific data sources
Step 3 - Assess what you find:
After you've found a dataset that you think might be useful to you, make sure that you assess it for relevance and quality (understandability/usability and trustworthiness) to ensure that you don't waste time trying to analyse data that doesn't meet your needs.
Relevance
Use the metadata associated with the dataset to make sure that it meets all of the criteria that you established before you started searching. Double check that:- The coverage of the dataset is sufficient for your needs
- The file format is compatible with the software that you plan on using for analysis
- The reuse licence applied to the dataset permits the activities that you will use the data for
Understandability
Look for readme files or other documentation that describes the dataset. To be understandable and usable a dataset must include:- Definitions for any technical terms, data codes or variables used
- Description of data collection procedures
- Description of data processing methods, including both the cleaning and analyses that were undertaken
- After reading the documentation, you should be able to understand what information is contained in the dataset and what can and cannot be done with the data.
Trustworthiness
Consider the trustworthiness of the data and the data source. Ask yourself:- Has the data been produced by a reputable source, such as a well-known organisation or researcher active in the field?
- Is there enough descriptive information about the data to satisfy you the original data collection and processing is trustworthy?
- Have the data been produced according to current best practices, or were outdated collection and analysis methods used?
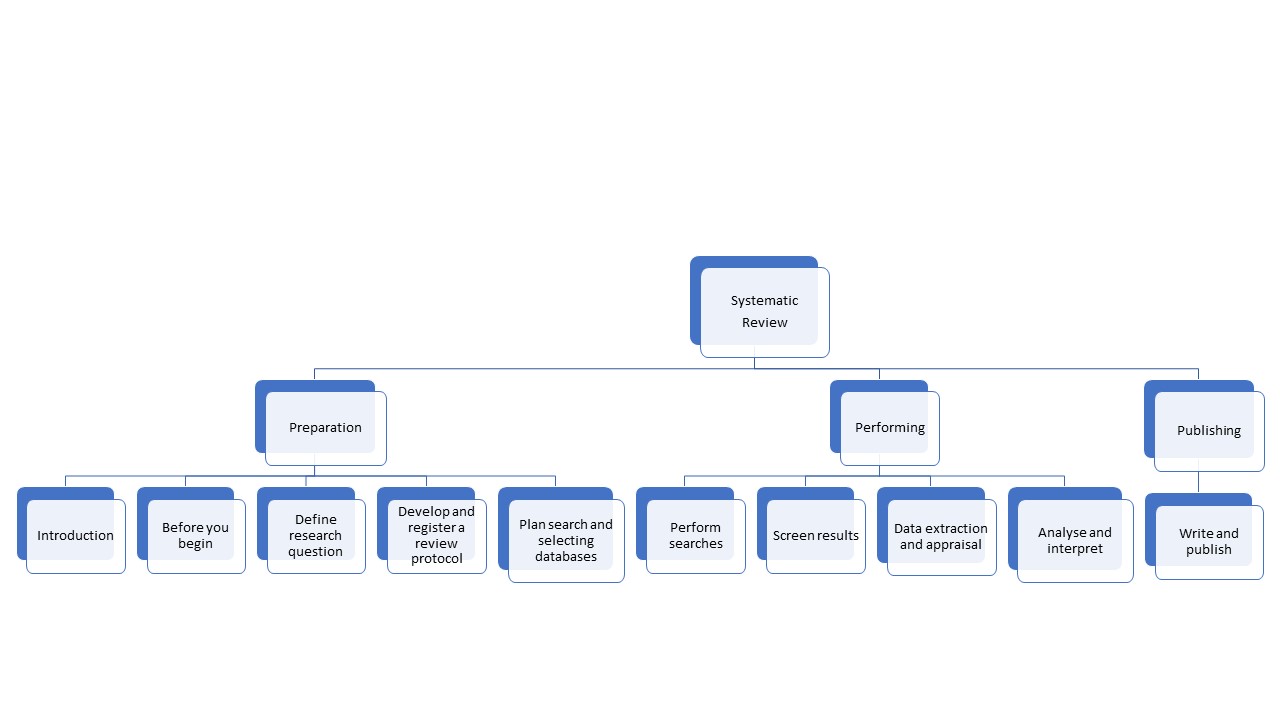
- Systematic review
A systematic review is a review of a clearly formulated question that uses systematic and reproducible methods to identify, select and critically appraise all relevant research, and to collect and analyse data from the studies that are included in the review.
Click on the following diagram to learn more about systematic reviews ⇒
- Open data
Open data - freely available and free-of-charge information without any restrictions for re-use that allows editing and automated processing with freely available software. (Likumi.lv, Freedom of Information Law)
Open data for use in research:
- Dataverse - RSU data repository
- Latvia’s Open Data portal offers data from different institutions (for example, the State Environmental Service data about permits for polluting activities) and within different categories, such as “Health”
- European Data portal offers European data (also in the category “Health”), as well as different tools and courses about open data
Manage data and information
- Plagiarism, references and citation styles
Plagiarism - the process or practice of using another person's ideas or work and pretending that it is your own (Cambridge dictionary).
Some examples of plagiarism:
- Copying large pieces of text from a source without citing that source.
- Taking passages from multiple sources, piecing them together, and turning in the work as your own.
- Copying from a source but changing a few words and phrases to disguise plagiarism.
- Turning in someone else's work as your own.
How to avoid plagiarism:
It's important to remember that plagiarism can be both intentional and unintentional. However, unintentional plagiarism carries the same consequences. There are steps you can take to avoid plagiarizing unintentionally:
- Quoting. Quoting means copying a piece of text word-for-word. The copied text must be introduced in your own words, enclosed in quotation marks, and correctly attributed to the original author
- Paraphrasing. Paraphrasing means using your own words to explain something from a source. It allows you to give only the most important information from a passage.
- Crediting and keep track of your sources. Credit the original author in an in-text citation and reference list. While you’re doing research and taking notes for your paper, make sure to record the source of each piece of information. One way that students commit plagiarism is by simply forgetting where an idea came from and unintentionally presenting it as their own.
- Express your opinions and ideas. Critical thinking is crucial point of your research strategy, so it is important to express your ideas, which are formulated during your research.
Plagramme.com is the plagiarism checker where users can get plagiarism scores free and in seconds.
- EndNote - citation manager
A citation manager helps you keep track of articles and books as you find them, tag and annotate them, and easily create citations and bibliographies in Microsoft Word, Google Docs, or other writing software. Using any citation manager will be more efficient than not using one at all.
In case of inqueries, please contact Inga[pnkts]Znotina
 rsu[pnkts]lv
EndNote offers more than 6,000 bibliographic styles for downloading
EndNote is the industry standard software tool for publishing and managing bibliographies, citations and references. There are different versions available:
- EndNote Basic is a free limited web version with 21 styles and a limited number of filters and connection files. This version is available to everyone. 50,000 references and 2 GB attachments are allowed.
- EndNote Basic (Web of Science version) is a limited web version available to RSU faculty, students, and staff as part of the RSU Web of Science subscription. As with the free version of EndNote Basic, a maximum of 50,000 references and 2 GB of attachments are allowed. In addition, the EndNote Basic Web of Science version has more than 4,000 styles and hundreds of filters and connection files.
- EndNote Desktop is a standalone, complete PC software package for a fee.
EndNote installation and user instructions
- Mendeley - reference manager
Mendeley Reference Manager
“Mendeley” is a free reference manager that can help you store, organize, note, share, cite references and research data. All versions and extensions are available to everyone. 2 GB attachments are allowed. “Mendeley” provides access to nearly 7000 citation styles.
Because “Mendeley” is an ELSEVIER product, you can sign up with an ELSEVIER account, the same one that uses to connect to “Scopus” and “Science Direct”, to make it easier to add and cite references. But you can also create a new account on the “Mendeley” website.
Mendeley Desktop is the downloaded part of the software installed onto your computer. Available for “Windows”, “MacOS” and “Linux”. From 1 September 2022, users will no longer be able to download and install “Mendeley Desktop” software. Existing users of “Mendeley Desktop” will continue to be able to sign into, use and sync their “Mendeley Desktop”.
Mendeley Web Importer is an extension for web browsers which helps you to add references to your library with full text PDFs. It is available in all web browsers. To add the extension to the “Opera” browser, use the “Chrome Web Store” link.
Mendeley Cite add-in for “Microsoft Word” allows you to easily insert references from your “Mendeley” library into your “Word” document, change your citation style and generate a bibliography - all without leaving your document.
The most convenient way to search and export references is in the “Mendeley” search engine itself. All you have to do is press “Add to library”. Various filters are available to select the one you want. Also, easy to export references are from “Scopus” and “Science Direct”, as these are ELSEVIER products.
When you start working with “Mendeley”, they have a 2021 “Quick User Guide” on their website, with pictures and explanations that are very useful, especially if you haven't worked with reference tools before, because the basics are similar to “EndNote”.
There are also “Help Guides” on the “Mendeley” website, which provide brief instructions on how and what to do with the “Mendeley Reference Manager” and extensions.
- Data management
Research Data Management is the care and maintenance of the data that is produced during the course of a research cycle. It is an integral part of the research process and helps to ensure that your data is properly organized, described, preserved, and shared. This includes the day-to-day management of research data during the life of the research project. It also includes decisions on how the data will be stored and shared after the end of the project (eg storing the data in a repository for long-term archiving and access).
What´s in it for me?
- Make research more efficient.
- Comply with funders mandates.
- Comply with data protection law and protect data subjects.
- Agree about data ownership, sharing and preservation.
- Ensure that the necessary resources are available.
- Make research reproducible and FAIR.
Research data management (RSU)
Data management checklist (UK)
UK Data Service - provide examples of the best practices
Digital Curation Centre’s (DCC)
An important first step in managing your research data is planning. To get you started thinking about data management planning, here are some of the issues you need to consider:
- Your institution's and funding agency's expectations and policies.
- Whether you collect new data or reuse existing data.
- The kind of data collected and its format.
- The quantity of data collected.
- Whether versions of the data need to be tracked.
- Storage of active data and backup policy and implementation.
- Storage and archiving options and requirements.
- Organizing and describing or labeling the data.
- Data access and sharing.
- Privacy, consent, intellectual property, and security issues.
- Roles and responsibilities for data management on your research team.
- Budgeting for data management.
What should I focus on when organizing data?
There are some fundamental decisions that you need to make when you start your research, and data organization should be within this set. The choices that you make will vary based on type of research that you do, but everyone must address the same issues.- File Version Control.
- Directory Structure/File Naming Conventions.
- File Naming Conventions for Specific Disciplines.
- File Structure.
- Use Same Structure for Backups.
File Naming
File Naming is often taken for granted. Best practice is that the names are descriptive – they reflect the content of the file. Be consistent – use the same format for all of the files in a project, including data set files and zip or tar files. Some suggested attributes to include:
- Unique identifier or project name/acronym.
- PI.
- Location/spatial coordinates.
- Year of study.
- Data type.
- Version number.
- File type.
Use no more than 32 characters. Use only numbers, letters, and underscores. Do not use special characters, dashes, spaces, or multiple dots or stops. Avoid using common terms (‘data’, ‘sample’, ‘final’, or ‘revision’). Use consistent case – all lower case, or all UPPER CASE, or Lower case. Dates should be in a standard format – YYYYMMDD, which will allow them to sort chronologically.
Example: [Date] _ [Project] _ [Location] _ [Method]
Version Control
Version control is the way to track revisions of a data set, or a process. If your research involves more than one person, it is essential. You will want to record every change to a file, no matter how small. Keep track of the changes to a file in your file naming convention and log files, or version control software. File sharing software can also be used to track versions.
You can do it manually by including a version control indicator in the file name, such as v01, v02, v1.4. The standard convention is to use whole numbers for major revisions, and decimals for minor ones.
There are several software programs that are designed for managing versions tracking. Mercurial, TortiseSVN, Apache Subversion, Git, and SmartSVN.
File sharing software can also be used to track versions. UVaBox has options to track both major and minor versions of files. Google Docs records version changes as well.
As you think through how to manage this step, keep the following issues in mind:
- Record every change to a file, no matter how small.
- Keep track of changes to files.
- Use file naming conventions.
- Headers inside the file.
- Log files.
- Version control software (SVN, Git, Subversion).
- File sharing software (UVaBox, Google Docs).
Data Documentation & Metadata
Ensuring that data be understood, interpreted and used, requires clear and detailed data documentation. Sharing data for long-lasting usability would be impossible with out documentation (also known as metadata) .
It is important to begin to document your data at the very beginning of your research project and continue throughout the project. By doing so will make data documentation easier and reduce the likelihood that you will forget aspects of your data later in the research project. Don’t wait until the end to start to document your research project and its data!
What to Document?
Research Project Documentation:
- Context of data collection.
- Data collection methods.
- Structure, organization of data files.
- Data sources used (see Citing Data).
- Data validation, quality assurance.
- Transformations of data from the raw data through analysis.
- Information on confidentiality, access & use conditions.
Dataset documentation:
- Variable names, and descriptions.
- Explanation of codes and classification schemes used.
- Algorithms used to transform data.
- File format and software (including version) used.
Examples of documentation:
Readme files - Cornell’s Guide to writing "readme" style metadata
ICPSR’s Guide to social science data preparation and archiving (Social sciences)
Data vocabularies & Codebooks - Data Ab Initio's Data dictionaries; McGill University Health Center's Codebook cookbook: How to enter and document your data; ICPSR's What is a codebook?
Laboratory Records - Rice Universities Experimental Bioscience’s Guidelines for keeping a laboratory record; Colin Purrington's Maintaining a laboratory notebook; University of Oregon Harm Lab's Data management in the lab
- Data archiving
Archiving data that is no longer actively used by you or your research team will ensure that your data is stored securely to prevent data loss in the long term. Archiving your data will ensure continued access for you, or for others if you choose to publish or share your data.
File formats
When preserving and publishing data it’s essential that all datasets are saved in an appropriate file format to ensure long-term accessibility of data. The file formats you use when working with your data may not be appropriate for archiving or publishing purposes. You should think about capturing data or converting files into formats that are:
- widely used within your discipline
- publicly documented, i.e. the complete file specification is publicly available
- open and non-proprietary
- endorsed by standards agencies such as the International Organisation for Standardization (ISO)
- self-documenting, i.e. the file itself can include useful metadata
- unencrypted
- uncompressed or that use lossless compression
For example:
- Quantitative research data
While you collect and analyse your data, you might need it in a number of different formats: an Excel spreadsheet, a database, an SPSS, SAS, R, MATLAB or other file format native to the specific data analysis software you are using.
Once the data’s been collected and the analysis performed, save the data as a comma separated values (.csv) file for long-term storage. Most data software packages provide options for saving data as a comma separated values file. This format is portable across different computing and software platforms and is therefore more resilient to software updates.- Image files
The uncompressed TIFF (Tagged Image File Format) is a good choice for long-term preservation of image files. Most image creation software packages provide options for saving images as TIFF files. You should save your image files in this format right from the outset, so that you capture the highest possible quality master image files.
While working with your images, you may need to manipulate, share, or embed them in other documents. For these purposes it may be useful to compress your image files into JPEG format so that they’re smaller and easier to send over the internet or embed in analysis project files.Doorn, P., Tjalsma, H. Introduction: archiving research data. Arch Sci 7, 1–20 (2007). https://doi.org/10.1007/s10502-007-9054-6
- Data visualization
Data analysis is any task undertaken to try and discover meaningful information from a dataset. This covers a huge range of activities, from looking for correlations and performing statistical analyses, to describing and analysing images or text to draw out thematic relationships.
Analysis Tools:
- NVivo – allows you to handle rich text based information, where deep levels of analysis on both small and large volumes of data are required. It removes many of the manual tasks associated with analysis, like classifying, sorting and arranging information, so you have more time to explore trends, build and test theories and ultimately arrive at answers to questions. The Statistics Unit of RSU Faculty of Medicine
- Microsoft Excel – A spreadsheet application that is part of the Microsoft Office356 package made available by the University. Excel uses a grid of cells to organise data manipulations and arithmetic, and offers graphing tools, pivot tables and a macro programming language.
- SPSS – one of the statistics packages made available by the University, SPSS offers you the ability to analyse large datasets efficiently and easily and uncover unexpected relationships in the data using an intuitive visual interface. RSU staff and students can now access SPSS at RSU computer classrooms and at the Library.
In addition to commercial software, a host of open-source and/or freely available tools exist for data analysis. We have collected a short list of some of the more widely used, or easy to use tools that are available.
- OpenRefine – a powerful tool for working with messy data: cleaning it, transforming it from one format into another, and extending it with web services and external data.
- Google Fusion Tables – is an experimental data visualization web application to gather, visualize, and share data tables.
Stastistical & Qualitative data analysis software: Free software (Kent State University)
Data visualisation refers to any way of presenting information so that it can be interpreted visually. This is a pretty broad bucket that can include things like charts or graphs, diagrams, images, animations, and infographics. Data visualisation makes use of our ability to recognise trends, patterns and relationships to draw out meaning from our data. This can be useful in analysing your data (yes, data visualisation can be an important activity in data analysis!), or in communicating the results of your work to others.
Who is the visualisation for?
Thinking about the intended audience, or what the purpose of your visualisation is, before you start making it will help you to create the most appropriate visualisation for your needs. It can also help you save time when visualising your data, as you'll only include elements that'll be useful for your intended audience. You could be making a visualisation for:
- Yourself – visualising your data can be an important part of data analysis during research, allowing you to discover trends in your data, elucidate relationships, or even plan out future data collection. In making this kind of visualisation, you don't need to be producing a polished end product. Instead, you should develop a workflow that allows you to visualise your data quickly, and in a repeatable manner. Make sure that you document your visualisation workflow to allow you to re-use it in future analyses, and to ensure that you know how you produced a particular visualisation. Documentation may seem dull, but in a few months, you'll be very glad you did it!
- Others in your field – visualisations can be an important part of disseminating your results to researchers in your field, through figures in papers or posters, or as part of conference presentations. These visualisations are showing off your work, and so need to be polished, clear, and well annotated. You should consider employing figure types that are commonly used in your field, as familiarity with the layout will help your audience to quickly grasp your results. Common conventions for visualisations should be adhered to if possible, as not doing so can introduce unnecessary confusion. For example, maps are normally drawn with north to the top of the page; a map that's oriented in a different direction stands a higher chance of being misunderstood by readers.
- Public outreach – visualisations can be an excellent way to engage the interest of non-specialists in the results of a research project. These visualisations should be kept very simple and clear - don't try to display too much competing information on a single visualisation! Clear annotations and descriptions of what's being displayed should be provided, but make sure to avoid using any specialist terminology in your descriptions. It's a good idea to highlight any key points on your visualisation, as a public audience might lack the specialist knowledge to pick out the main messages without prompting.
Accessibility considerations – it's a good idea when creating a visualisation to consider whether your audience might include people with visual impairments, such as colour blindness. To keep your visualisation accessible, ensure that colour isn't the sole way of conveying information by using patterns and labels to help differentiate the information. You can also find colour hues and saturation that will still be differentiable to colour blind vision. Resources like ColorBrewer allow you to come up with colour blind safe (as well as printing in grey-scale safe!) colour palettes.
How will the visualisation be displayed?
The medium that the visualisation will be presented in will influence what kind of visualisation you can choose to create. Presenting information accurately is the driving motivation behind data visualisation, and choosing the right visualisation format can help you avoid presenting a misleading view of your data. An important consideration is whether a visualisation will be static, or if the medium it's presented in allows for animation or interaction.
Visualisations that'll be printed, such as figures in papers, or on posters, will be static. In these cases you might wish to use several different visualisations: one that provides a clear overview of the story that your data is telling, and subsequent secondary visualisations that allow viewers to drill deeper into your data, or explore it from another angle.
Other formats for displaying visualisations, for instance presentations or websites, allow for dynamic visualisations, such as animations or interactive visualisations. Animations are an effective way of displaying data that changes through time, or with some other variable.
Resources:
Data analysis and visualisation: Creating a Visualisation. Subject guides. Library. The University of Sydney.
Data analysis and visualisation: Visualisation Tools. Subject guides. Library. The University of Sydney.
- Text and data mining
TDM (Text and Data Mining) is the automated process of selecting and analyzing large amounts of text or data resources for purposes such as searching, finding patterns, discovering relationships, semantic analysis and learning how content relates to ideas and needs in a way that can provide valuable information needed for studies, research, etc. (Springer Nature, 2020).
Before start with TDM, make sure that you are aware of:
- Ethical issues that may arise from the use of your content, especially when linking datasets or handling confidential information.
- Copyright and licensing issues with the content you wish to use.
- Requirements of data providers regarding access to their content.
Data mining involves using computational methods to discover patterns and relationships in large, structured datasets. Structured data is organised in a defined format, allowing it to be easily parsed, manipulated, or have calculations performed on it by a computer. For example, data organised in tables or databases or in files with structured formats, such as XML files.
Text mining is similar but, in this case, computational analysis is used on unstructured text to discover patterns and relationships. Unstructured text has no defined organisation for a computer to work with, so different methods are needed to enable these analyses.
Unstructured text is often accompanied by structured information about the text, such as the author, title, the year the text was published, or the number of pages in the work. This mix of mostly unstructured and some structured data has led to different names being used to describe a similar set of activities. Text and data mining, text data mining, TDM and text mining are all variously used to describe the computational analysis of unstructured text and these terms are often used interchangeably.
TDM Steps:
1. Is TDM right for you?
Increasingly, information is being collected and stored digitally in huge volumes. Older archival and print media is also being digitised. If you have a research question that would best be answered by large amounts of data or text, then TDM could be for you.
Questions to ask yourself:
- Do you have a research question that would be best answered by TDM methods
- Is the dataset/text you plan to use machine readable?
- Is the dataset/text you intend to use appropriate for answering your research question?
- Are you legally and ethically permitted to use a dataset/text?
2. Creating a dataset
Before you begin the process of text or data mining, you need to create a dataset, which is called a corpus. The choices you making in assembling a corpus to mine and analyse will be crucial to the success of your project. Having developed a research question, you need to:
Consider what content or information you need that will answer your research question.
Review what resources are available for mining
This will save time and help you to choose the mining methods best suited to your project.To use TDM, you must:
- Assemble a corpus. Is the data available to me to use? Where is the data coming from? (Primary or secondary sources? Is there any bias?) What is the geographical coverage of the data set? What is the time period or date range that the data covers? Is the data clean and ready to use? What kinds of cleaning might the data require? Evaluating data availability: what kind of data can you access? For instance, do you have access to metadata, abstracts or full text?
- Know if a computer is able to read your text. In order for text and data mining to occur, a computer must be able to read your text. A simple, but not fool-proof, test to see if your text is machine-readable is to use the 'find' command to search for a word that you can see in your document. If the computer can find it, it can read your text
- Be aware of how to find databases that allow TDM.
3. Licensing, copyright and ethics
From the outset, ensure that your text and data mining activities and the subsequent publication of your research comply with any licensing terms and conditions and copyright and ethical requirements.
4. Cleaning and preparing data
Having generated a corpus, you now need to take some steps to make sure that your texts are in a form that a computer can understand and work with. ‘Pre-processing’ is a catch-all term used for the different activities that you undertake to get your documents ready to be analysed. You may only use a few pre-processing techniques, or you may decide to use a wide array, depending on your documents, the kind of text you have and the kinds of analyses you want to perform.
The first pre-processing step in any TDM project is to identify the cleaning that will need to be done to enable your analysis. Cleaning refers to steps that you take to standardise your text and to remove text and characters that aren’t relevant. After performing these steps, you'll be left with a nice ‘clean’ text dataset that is ready to be analysed.
Some TDM methods require that extra context be added to your corpus before analysis can be undertaken. Pre-processing techniques, such as parts of speech tagging and named entity recognition, can enable these analyses by categorising and assigning meaning to elements in your text.
Cleaning and pre-processing methods may sometimes be included within the interface of the TDM tool that you are using. Examples of tools that have some cleaning and pre-processing methods as part of them include:
5. Text and data mining methods
Common methods include:
- Topic modelling.
- Sentiment analysis.
- Term frequency.
- Collocation analysis.
6. Tools and resources
Tools and assistance for Text and Data Mining:
- Voyant Tools
- Gale Digital Scholar Lab
- Data Science Toolkit
- Sample Project using Data Science Toolkit
- Stylo R Package
- Sample project using Stylo R package
- AntConc
Resources for Text and Data Mining:
- TAPoR – Text Analysis Portal for Research
- Programming Historian tutorials
- Data Analysis and Visualisation Toolkit
- Sydney Informatics Hub
Resources:
Text and data mining. Subject guides. Library. The University of Sydney.
Publish information and data
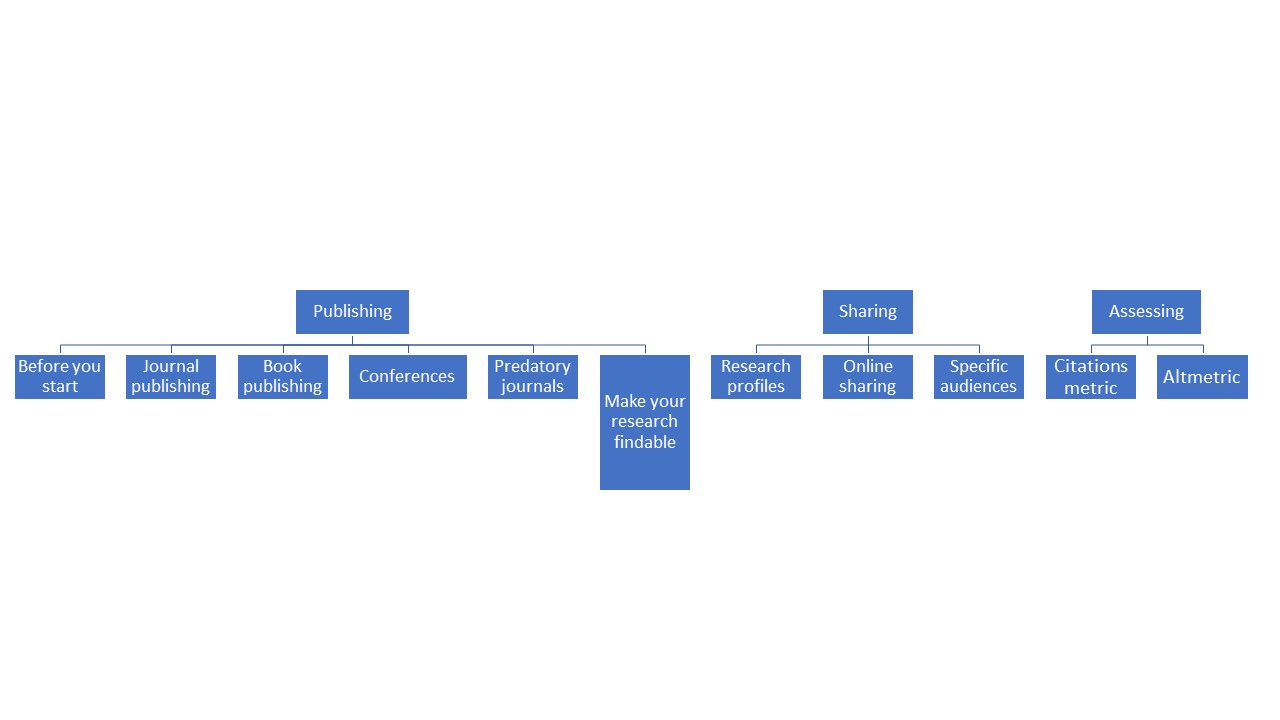
- Strategic publishing
Strategic publishing means developing a clear plan to ensure you are reaching your target audience and supporting your career goals.
Maximise the impact of your research by having a well-informed plan for:
- Where to publish.
- Sharing your research after publication.
- Evaluating whether or not your strategy was successful.
This resource helps you to focus on key decisions in the publishing lifecycle that increase the potential for your research to gain attention and engagement.
Publish or Perish: Graduate Students' Guide to Publishing.
SAGE guide: How to get your journal article published.
SAGE webinars: How to get published.
Click here to learn more about the steps of strategic publishing ⇒
- Open access
Open access means making your research available online, free of cost or other barriers to access. Open access provides an opportunity to achieve the widest communication of your research, maximising the reach and impact of your work. Open access publication is a vital issue for the development and transparency of research.
All types of research outputs can be made open access, including journal articles, reports, theses, books, research data and "non-traditional" research outputs, including creative works.
Most academic funders require the open international publication of research results. However, publishing in open access publications is not necessarily free of charge. Researchers often have to pay author fees for open access publications, and separate funding is typically not provided to cover these fees.
The benefits of publishing your research open access include:
- Increased citation and use of journal articles when compared to articles available only by subscription, i.e. behind a "paywall";
- Greater public engagement as your research can be accessed by anyone (The University of Sydney Library).
Types of open access publishing and archiving for journal articles:
Gold open access – publishing your article in an open access journal. Your article will be immediately openly available on the publisher's website upon publication. Publishing in an open access journal will usually incur an Article Processing Charge (APC).
Green open access – making a copy of your accepted manuscript (post-print) available in an open access repository (self-archiving). There is no charge to archive/deposit a work in an open access repository. The publisher's version of the article will only be accessible to subscribers.
Hybrid open access – making individual articles open access immediately upon publication after payment of an APC, while other articles in the journal remain available only to subscribers. Journals offering hybrid open access may also offer an option for self-archiving (green open access)(The University of Sydney Library).
Open science refers to the mechanisms by which the findability, accessibility and use of scientific knowledge is promoted in the digital era.
This encompasses open research outcomes, including:
- Publications;
- Research data;
- Research methods;
- Open source code.
In addition to the above, open science refers to:
- Open research infrastructures;
- Research-based open learning material;
- Inclusive research processes such as citizen science (University of Helsinki).
Open science contributes to the reliability and self-correction of science. Open access to research-based knowledge is also key for the societal and global impact of universities.
OpenAIRE is a European project supporting Open Science. It is an network of dedicated Open Science experts promoting and providing training on Open Science.
Open Science: Empowering Knowledge (Elsevier) - Infographics
Wiley. Open access options for your article.
eLife works to improve research communication through open science and open technology innovation.
The Goethe-Institut offers access to Open Access content - 3 million scientific publications included in the common list of all German research libraries (GVI). These include books, articles, dissertations, as well as newspaper and magazine articles in various languages (mainly German and English).
- Research data publishing
Data publication is the release of data and data documentation following data collection and analysis. Data publication is an increasingly common standard that bolsters research transparency and reproducibility. Preparation for data publication begins in the early stages of research: effective data management and analytics throughout the project will ensure that the research team can easily publish data when the time comes and that outside users can access and use the data to replicate the researcher's primary results.
Practical steps to publish the research data - publishing the underlying research data increases citations to your journal articles and other publications. Follow these instructions to get maximum impact with reasonable effort. (Aalto university)
Step 1. Prepare data for publishing
- Check what data you can publish
- Choose data for publishing
Step 2. Upload your data to repository
- Choose repository
- Upload your data to the repository
- Describe your dataset in repository
- choose the license for your data
Step 3. Make your dataset known
- Add the identifier of the dataset to your publication
- Register the dataset to Dataverse
Some journals may require publication as a requirement for you to share your information. Data sharing policies can often be found in the "Author Guidelines" or "Author Guidelines" section.
Example: Nature - Availability of data; Wiley - Sharing and Citing your Research Data; Taylor&Francis - Data availability statement; BMJ - Author HUB; Elsevier - sharing research data; Plos One - data availability
The World Bank. Publishing data. Contents
1. Read First
2. Preparing for Release
- Preparing Data
- Preparing Data Documentation
- Preparing Code and Directory
3. Publishing
4. Author’s Preprint
EC. Open research. Data guidelines.
Tegbaru, D., Braverman, L., Zietman, A. L., Yom, S. S., Lee, W. R., Miller, R. C., ... & Dekker, A. (2019). ASTRO Journals’ Data Sharing Policy and Recommended Best Practices. Advances in radiation oncology, 4(4), 551-558. https://doi.org/10.1016/j.adro.2019.08.002
- Copyright
Copyright shall belong to the author as soon as a work is created, regardless of whether it has been completed. It shall apply to works of literature, science, art, and other works, also unfinished works, regardless of the purpose of the work and the value, form or type of expression. Proof of copyright ownership shall not require registration, special documentation for the work or conformity with any other formalities.
You can choose an open licence to maintain your copyright while enabling the public to use and remix your creative work. An open licence grants permissions and states restrictions; the specific permissions granted depend on the type of open licence you choose.
Resources:
Communication
- Researcher profile
ORCID provides a persistent digital identifier (an ORCID iD) that you own and control, and that distinguishes you from every other researcher. It is possible to add professional information to the ORCID iD - the researcher's membership in the organization or organizations, scholarships, publications, etc. ORCID iD can be used to share your professional information in other systems and databases by adding it to the author's information.
- Academic social networks
Academic social networks such as Academia.edu and ResearchGate are becoming very popular among academics. These sites allow uploading academic articles, abstracts, and links to published articles; track demand for published articles, and engage in professional interaction.
- ResearchGate is the professional network for scientists and researchers. Over 20 million members from all over the world use it to share, discover, and discuss research. We're guided by our mission to connect the world of science and make research open to all.
- Google Scholar Many researchers use Google Scholar to help establish their scholarly credentials. Creating a Google Scholar Profile can help you raise your visibility as a scholar and make sure you’re getting credit for all of your publications. The resource helps authors decide where to publish - for example, an author can browse top journals in a variety of industries, sorted by their h-index and h-median over the past 5 years.
- Academia is a platform designed to share academic research. The platform is already used by 150 million users and contains 22 million studies. Supports open access. In addition to subscribing to Academia Premium, researchers have access to more detailed information, such as authors with advanced publication analysis and impact tracking tools.
- Penprofile is an academic social networking that fosters global (social) interactions among academics/scholars, students and educational organizations with a view to causing enormous diffusion of knowledge growth and development. It has robust inbuilt features/sections such as profile creation for individual and organization, a unique article/blogging platform, group creation, research reviews, academic news such as job placements, writing opportunities, call for papers, conferences, and a lot more membership opportunities.
- Mendeley is a free citation management software program that lets you store and organize references. It also has academic social networking features.
Social media for researchers: Elsevier Researcher academy (Presentation)
- PubLons
In today's highly competitive research environment, researchers are often asked to make their impact visible. Web of Science has made it possible for researchers to quickly and easily track and demonstrate their impact as authors, journal editors, and peer reviewers, in one place.
Use Publons to track your publications, citation metrics, peer reviews, and journal editing work in a single, easy-to-maintain profile.
- All your publications, instantly imported from Web of Science, ORCID, or your bibliographic reference manager (e.g. EndNote or Mendeley).
- Trusted citation metrics, automatically imported from the Web of Science.
- Your verified peer review and journal editing history, powered by partnerships with thousands of scholarly journals.
- Downloadable record summarizing your scholarly impact as an author, editor and peer reviewer.
Resources:
Measure impact
- Citation metrics
Citation metrics are used to help determine the relative quality and impact of a single article or the research output of an individual, group or institution using citation counts.
Citation metrics include:
- Citation Rate.
- Citations Received Per Year.
- Mean Citation Rate.
- Median Citation Rate.
Author-level metrics
- H-index is a metric calculated using publication and citation rates and can help determine relative quality of an author's work based on both productivity and impact. H-index calculation tools are Web of Science, Scopus and Google Scholar.
- G-index is introduced as an improvement of the h-index of Hirsch to measure the global citation performance of a set of articles.
- i10-index is the number of publications with at least 10 citations. It was introduced by Google in July 2011 as part of Google Scholar.
Journal-level metrics – Journal Citation Report, Eigenfactor, SJR.
Article-Level Metrics – Google Scholar, Scopus, Web of Science, SNIP.
- SCiVal
SciVal offers quick, easy access to the research performance of 4,600 institutions and 220 countries. Can navigate the world of research and devise an optimal plan to drive and analyze your performance. A great tool for benchmarking your progress and looking at collaborative partnerships. Uses the Scopus Dataset for its analysis.
SciVal contains:
- 23,500+ peer-reviewed journals
- 300+ industry publications
- 194,000+ books
- 740+ book series
- 9+ million conference papers
SciVal analytical tool offers to evaluate authors, institutions, research groups by number of publications, influencing factors, number of views and other bibliographic data. The tool allows to objectively compare the publications of Latvian authors with similar publications of authors from other countries. SciVal requires individual registration, indicating the RSU data.
SciVal Consists of:
- Overview. Provides overview data for up to 9,000 institutions for time periods 2012-2016.
- Benchmarking. Enables you to benchmark multiple institutions for any time period, dating back to 1996.
- Collaboration. Shows the collaborating institutions in addition to the individual authors and papers.
- Trends. Enables you to explore specific topics and investigate universities and authors publishing in that topic.
SciVal offers a wide range of simple and sophisticated metrics, including Snowball metrics, which have been identified in collaboration with academia and industry to ensure that they are used safely and appropriately in strategic decision-making and benchmarking.
Metrics in SciVal - what are they and what are their strengths and weaknesses?
- Altmetrics
Altmetrics, or alternative metrics, capture a range of activity to measure engagement and attention from audiences beyond academia. Like citation metrics, altmetrics have limitations and should be used as a complement to other indicators.
Benefits of Altmetrics:
- Capture elements of societal impact. Altmetrics data can inform researchers of elements of the societal impact of their research. For example, altmetrics data can help researchers understand how their research is being interacted with by the public, government, policy makers, and other researchers.
- Complement traditional metrics. Altmetrics provide a wider range of data, from a wider range of sources than traditional metrics. Altmetrics data is also highly nuanced and can be provided in high detail and in the context in which it originates.
- Offer speed and discoverability. Altmetrics data accumulates at a faster speed compared to traditional metrics. In disciplines where citations grow slowly, or in the context of new researchers, this speed helps determine which outputs are gaining online attention.
- Open access advantage. Providers like Altmetric.com and ImpactStory provide access to their API and source code. Altmetrics providers also pull their data from open sources, who give access to their APIs or raw usage data, which makes altmetrics data more easily replicable than data in proprietary databases.
Considerations for Altmetrics
Altmetrics offer a lot of information. Here are some considerations to keep in mind when using and analyzing altmetrics data.
- Altmetrics lack a standard definition. The field of altmetrics remains undecided on what altmetrics truly measure. However, the NISO Alternative Assessment Metrics (Altmetrics) Initiative is currently working to create a standard definition of the term and has a draft of its definition open for public comment.
- Altmetrics data are not normalized. It is not advised to compare between sources and data sets for altmetrics, as different providers collect different kinds of data. Instead, we suggest using altmetrics to tell a story about your research - see the "Use Cases" tab for more information.
- Almetrics are time-dependent. Altmetrics provide information about the use of the work, but much of this use has a lifespan - and that lifespan is unknown. For older works, there may not be much altmetrics activity, but that does not necessarily mean that the work is not heavily used!
- Altmetrics have known tracking issues. Altmetrics work best with items that have a Digital Object Identifier (DOI). PlumX is one provider that can track usage of an item with only a URL, but not all providers provide the same level of tracking for items without DOIs.
What can Altmetrics do for me?
- Explore the impact of your research beyond “traditional” journal-level metrics. See how different audiences—from fellow researchers to middle school students—are engaging with your scholarship on the open web.
- Show funders the broad reach of an article that was produced from your grant research.
- Manage your scholarly reputation. Keep abreast of who is talking about your research and what they are saying. Include altmetrics on your CV and professional website.
- Compare your work to others in your field. Discover what articles at Pitt and other institutions are getting the most attention and work to improve the reach of your own work.
PLOS has been a leader in providing altmetrics. Each article they publish has a "Metrics" section that provides a lot of information. RSU subscribed databases: Science Direct; Scopus, ProQuest Ebook Central, SAGE publications, BMJ journals, Wiley online Library, The Cochrane Library.
Altmetrics can answer following questions:
- How many times has the document been downloaded?
- Who reads my work? (Mendeley, bookmarking sites, etc.)
- Was it covered by a news agency?
- Do other researchers comment on this?
- How many times has it been shared? (Facebook, Twitter, etc.)
- In which countries do I search / view / read my research?
Articles by Item Type:
- Citations: Scopus, Web of Science, PubMed Central, and Google Scholar citations; citations in policy documents.
- Bookmarks: scholarly bookmarks on Mendeley & CiteULike; bookmarks by the public on Delicious & Pinboard; Twitter favorites.
- Discussion: peer reviews on F1000, Publons, and other post-publication peer review websites; Twitter mentions and Facebook wall posts; newspaper articles, videos, and podcasts; mentions on scholarly blog networks like ResearchBlogging.
- Shares: Twitter mentions, Facebook shares.
- Views: Pageview & download statistics from the journal website or repository where you've archived your paper
(Careless, J. 2013. Altmetrics 101: A Primer. (cover story). Information Today, 30(2), 1-36.)
Altmetric, Plum Analytics, Impactstory.
(Introduction to altmetrics. LibGiude. University of Pittsburgh)
Resources:
Williams, A. E. 2017. Altmetrics: an overview and evaluation. Online Information Review, 41(3), 311-317.
Barnes, C. (2015). The Use of Altmetrics as a Tool for Measuring Research Impact. Australian Academic & Research Libraries, 46(2), 121-134.
Related news
 RSU researcher defends doctoral thesis at the University of Vienna following years of research and eight months living in a residential care homeResearch, Admissions